

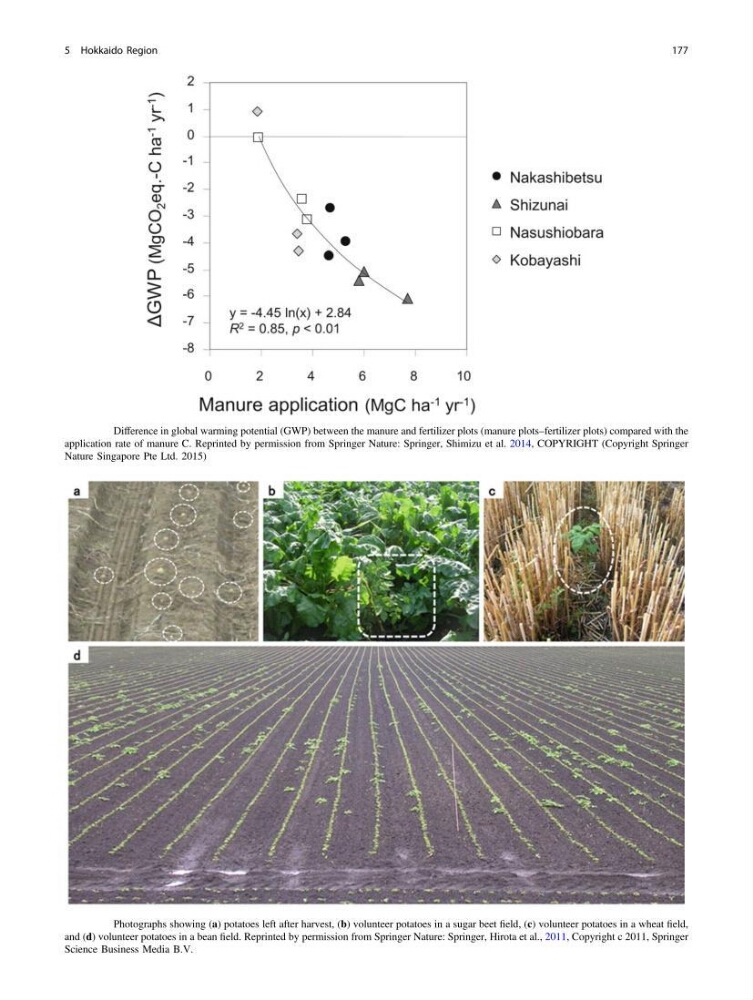
Fig. 5.17 Difference in global warming potential (GWP) between the manure and fertilizer plots (manure plots–fertilizer plots) compared with the
application rate of manure C. Reprinted by permission from Springer Nature: Springer, Shimizu et al. 2014, COPYRIGHT (Copyright Springer
Nature Singapore Pte Ltd. 2015)
Fig. 5.18 Photographs showing (a) potatoes left after harvest, (b) volunteer potatoes in a sugar beet field, (c) volunteer potatoes in a wheat field,
and (d) volunteer potatoes in a bean field. Reprinted by permission from Springer Nature: Springer, Hirota et al., 2011, Copyright c 2011, Springer
Science Business Media B.V.
5 Hokkaido Region
177
application rate of manure C. Reprinted by permission from Springer Nature: Springer, Shimizu et al. 2014, COPYRIGHT (Copyright Springer
Nature Singapore Pte Ltd. 2015)
Fig. 5.18 Photographs showing (a) potatoes left after harvest, (b) volunteer potatoes in a sugar beet field, (c) volunteer potatoes in a wheat field,
and (d) volunteer potatoes in a bean field. Reprinted by permission from Springer Nature: Springer, Hirota et al., 2011, Copyright c 2011, Springer
Science Business Media B.V.
5 Hokkaido Region
177