

(2) Effect of manure application on net ecosystem carbon balance (NECB)
The amounts of harvested C in the fertilizer and manure
plots were 4.3 ± 0.8 and 4.1 ± 0.6 Mg C ha
−1 yr
−1 ,
respectively, and there was no significant difference in harvested C among the sites or between the fertilizer and
manure plots. However, the NEE varied between the fertilizer and manure plots, being −2.4 ± 1.1 and
−1.6 ± 0.7 Mg C ha
−1 yr
−1 , respectively, and significant
differences in NEE were also found between the treatment
plots (p < 0.05). This indicates that more net CO 2 uptake
occurred in the fertilizer plots. However, there was no significant difference in grass production between fertilizer
plots and manure plots because harvested C in both plots
was in the same range. The difference in NEE between
treatments was 0.9 ± 0.9 Mg C ha
−1 yr
−1 on average, and
the rate of C loss as CO 2 from total amount of C applied in
manure in 3 years was estimated as 25 ± 37%. Therefore,
the differences in NEE between the plots was likely caused
by organic matter decomposition.
NECB was significantly higher in the fertilizer plots
(1.9 ± 0.9 Mg C ha
−1 yr
−1 ) than in the manure plots
(−1.8 ± 1.8 Mg C ha
−1 yr
−1 ), indicating that grassland soils
of all sites experience C loss without manure application.
(3) The effect of manure application on CH 4 and N 2 O
emissions
The CH 4 emissions ranged from −0.8 to 3.9 kg C ha
−1 yr
−1 .
CH 4 was emitted from poorly drained grassland because soil
moisture promotes microbial methanogenesis. There was no
significant difference in CH 4 emissions among plots (Shimizu et al. 2013).
The N 2 O emission from the manure plots was
6.2 ± 3.7 kg N ha
−1 yr
−1 and that from the fertilizer plots
was 3.6 ± 3.2 kg N ha
−1 yr
−1 (p < 0.05). High available C
from the applied manure and mineral N from the chemical
fertilizer may have enhanced denitrification and N 2 O production in the manure plots. Emissions of CO 2 and N 2 O
from arable soils would increase with increasing soil C and
N stocks as a result of the regular application of farmyard
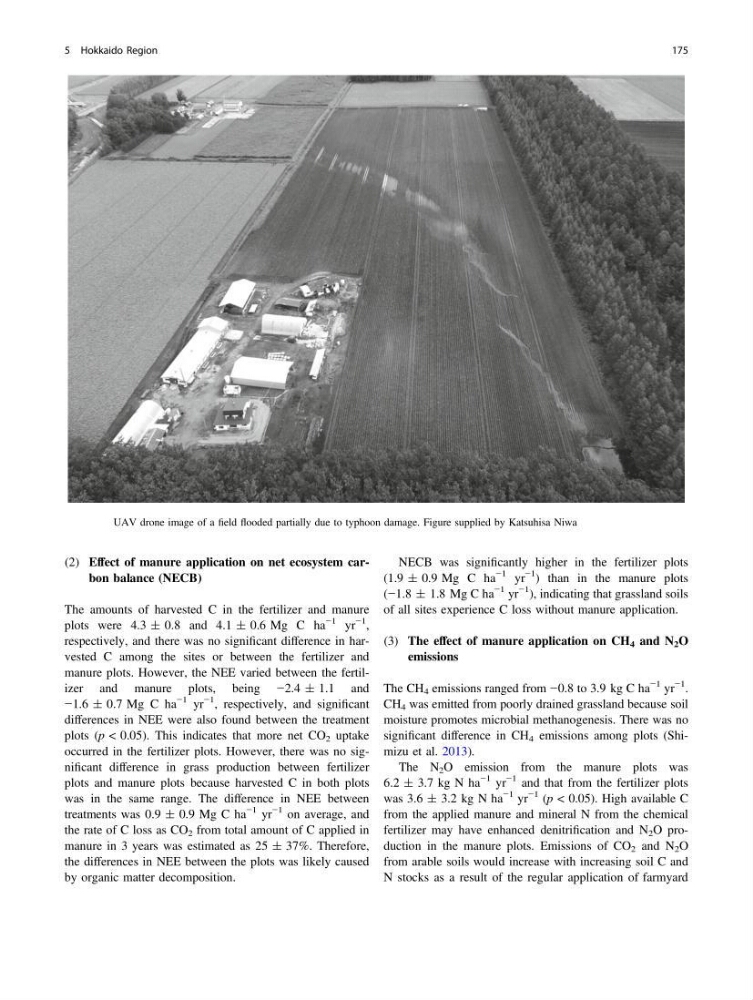
Fig. 5.15 UAV drone image of a field flooded partially due to typhoon damage. Figure supplied by Katsuhisa Niwa
5 Hokkaido Region
175
The amounts of harvested C in the fertilizer and manure
plots were 4.3 ± 0.8 and 4.1 ± 0.6 Mg C ha
−1 yr
−1 ,
respectively, and there was no significant difference in harvested C among the sites or between the fertilizer and
manure plots. However, the NEE varied between the fertilizer and manure plots, being −2.4 ± 1.1 and
−1.6 ± 0.7 Mg C ha
−1 yr
−1 , respectively, and significant
differences in NEE were also found between the treatment
plots (p < 0.05). This indicates that more net CO 2 uptake
occurred in the fertilizer plots. However, there was no significant difference in grass production between fertilizer
plots and manure plots because harvested C in both plots
was in the same range. The difference in NEE between
treatments was 0.9 ± 0.9 Mg C ha
−1 yr
−1 on average, and
the rate of C loss as CO 2 from total amount of C applied in
manure in 3 years was estimated as 25 ± 37%. Therefore,
the differences in NEE between the plots was likely caused
by organic matter decomposition.
NECB was significantly higher in the fertilizer plots
(1.9 ± 0.9 Mg C ha
−1 yr
−1 ) than in the manure plots
(−1.8 ± 1.8 Mg C ha
−1 yr
−1 ), indicating that grassland soils
of all sites experience C loss without manure application.
(3) The effect of manure application on CH 4 and N 2 O
emissions
The CH 4 emissions ranged from −0.8 to 3.9 kg C ha
−1 yr
−1 .
CH 4 was emitted from poorly drained grassland because soil
moisture promotes microbial methanogenesis. There was no
significant difference in CH 4 emissions among plots (Shimizu et al. 2013).
The N 2 O emission from the manure plots was
6.2 ± 3.7 kg N ha
−1 yr
−1 and that from the fertilizer plots
was 3.6 ± 3.2 kg N ha
−1 yr
−1 (p < 0.05). High available C
from the applied manure and mineral N from the chemical
fertilizer may have enhanced denitrification and N 2 O production in the manure plots. Emissions of CO 2 and N 2 O
from arable soils would increase with increasing soil C and
N stocks as a result of the regular application of farmyard
Fig. 5.15 UAV drone image of a field flooded partially due to typhoon damage. Figure supplied by Katsuhisa Niwa
5 Hokkaido Region
175