

Following these results, our system was introduced in an
area of upland field of about 120 ha in 2016 and about
160 ha in 2017.
Currently, the effect of our variable fertilizer application
system is continuously being studied for wheat and potato
crops.
In Hokkaido, the growth of field crops is restricted by
poor drainage, and pipe drains have therefore been constructed as a countermeasure. However, when three
typhoons passed through Hokkaido in 2016, enormous water
damage occurred in upland fields. As such, it is considered
that drainage improvement is still insufficient.
Under such circumstances, a request was made to photograph a field that had been partially flooded due to typhoon
damage using a UAV drone. The drone image clearly captured the partially flooded area (Fig. 5.15). After geometric
correction, a flood map was created by visual interpretation
and provided to the client. The map was used for the design
of a pipe drain system, which was then densely constructed
in the flooded area.
In this way, ICT can be utilized in various soil management techniques. From now on, it is important to apply ICT
not only to variable fertilizer applications, but also to soil
management for land improvement such as drainage
improvement.
5.9.2 Farmyard Manure Application
Applying livestock manure can allow the amount of chemical nitrogen fertilizer to be decreased and can increase the
soil carbon sequestration. Additionally, the application of
chemical N fertilizer and manure can decrease the methane
(CH 4 ) uptake in soils and increase nitrous oxide (N 2 O)
emissions. This section reports on the effect of the application of farmyard manure on the net ecosystem carbon
balance (NECB), emissions of CH 4 and N 2 O, and global
warming potential (GWP) at four managed grasslands on
Andosols under different climatic regions ranging from
warm to cool temperate (Shimizu et al. 2014).
(1) Evaluation method of the effect of farmyard manure
application
Two treatments were performed: one treatment with chemical fertilizer (fertilizer plot) and another treatment using
cattle manure and chemical fertilizer (manure plot). In the
manure plots, the nutrient supply rate from manure was
estimated by multiplying the manure application rate by the
mineralization rate, and the difference between nutrient
supply rate from manure alone and the nutrient supply rate in
the fertilizer plots was supplied to the manure plots with
chemical fertilizer. The N mineralization rates were estimated based on Uchida’s model (Shiga et al. 1985), which
was developed in Japan, and amounted to 13.2, 7.02, and
5.53% of total manure N in the first, second, and third years
after manure application, respectively. The application of
manure allowed the application rate of chemical fertilizer N
to be decreased by 12–35% of that in the fertilizer plots. In
both plots (fertilizer plot and manure plot) at each site, net
ecosystem exchange (NEE) was measured by the eddy
covariance method (Hirata et al. 2013). The NECB in hay
meadow grasslands, which includes C input through manure
application and C output through crop harvest as well as
NEE, was estimated using the following equation:
NECB ¼ NEE À C applied in manure þ harvested C
Positive NECB represents C loss from the ecosystem.
The fluxes of CH 4 and N 2 O were measured by dark chamber
methods. (Relative to CO 2 , the GWP values with a 100-year
time horizon are 25 times greater for CH 4 and 298 times
greater for N 2 O.)
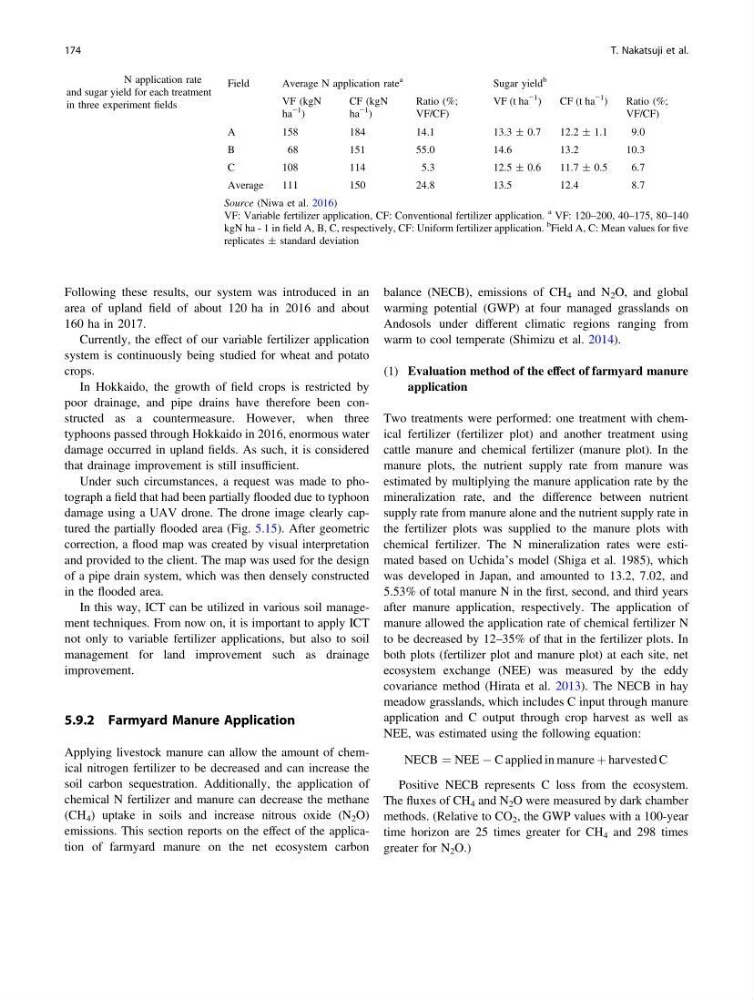
Table 5.21 N application rate
and sugar yield for each treatment
in three experiment fields
Field
Average N application rate
a
Sugar yield
b
VF (kgN
ha
−1
)
CF (kgN
ha
−1
)
Ratio (%;
VF/CF)
VF (t ha
−1 )
CF(tha
−1
)
Ratio (%;
VF/CF)
A
158
184
14.1
13.3 ± 0.7
12.2 ± 1.1
9.0
B
68
151
55.0
14.6
13.2
10.3
C
108
114
5.3
12.5 ± 0.6
11.7 ± 0.5
6.7
Average
111
150
24.8
13.5
12.4
8.7
Source (Niwa et al. 2016)
VF: Variable fertilizer application, CF: Conventional fertilizer application.
a VF: 120–200, 40–175, 80–140
kgN ha - 1 in field A, B, C, respectively, CF: Uniform fertilizer application.
b
Field A, C: Mean values for five
replicates ± standard deviation
174
T. Nakatsuji et al.
area of upland field of about 120 ha in 2016 and about
160 ha in 2017.
Currently, the effect of our variable fertilizer application
system is continuously being studied for wheat and potato
crops.
In Hokkaido, the growth of field crops is restricted by
poor drainage, and pipe drains have therefore been constructed as a countermeasure. However, when three
typhoons passed through Hokkaido in 2016, enormous water
damage occurred in upland fields. As such, it is considered
that drainage improvement is still insufficient.
Under such circumstances, a request was made to photograph a field that had been partially flooded due to typhoon
damage using a UAV drone. The drone image clearly captured the partially flooded area (Fig. 5.15). After geometric
correction, a flood map was created by visual interpretation
and provided to the client. The map was used for the design
of a pipe drain system, which was then densely constructed
in the flooded area.
In this way, ICT can be utilized in various soil management techniques. From now on, it is important to apply ICT
not only to variable fertilizer applications, but also to soil
management for land improvement such as drainage
improvement.
5.9.2 Farmyard Manure Application
Applying livestock manure can allow the amount of chemical nitrogen fertilizer to be decreased and can increase the
soil carbon sequestration. Additionally, the application of
chemical N fertilizer and manure can decrease the methane
(CH 4 ) uptake in soils and increase nitrous oxide (N 2 O)
emissions. This section reports on the effect of the application of farmyard manure on the net ecosystem carbon
balance (NECB), emissions of CH 4 and N 2 O, and global
warming potential (GWP) at four managed grasslands on
Andosols under different climatic regions ranging from
warm to cool temperate (Shimizu et al. 2014).
(1) Evaluation method of the effect of farmyard manure
application
Two treatments were performed: one treatment with chemical fertilizer (fertilizer plot) and another treatment using
cattle manure and chemical fertilizer (manure plot). In the
manure plots, the nutrient supply rate from manure was
estimated by multiplying the manure application rate by the
mineralization rate, and the difference between nutrient
supply rate from manure alone and the nutrient supply rate in
the fertilizer plots was supplied to the manure plots with
chemical fertilizer. The N mineralization rates were estimated based on Uchida’s model (Shiga et al. 1985), which
was developed in Japan, and amounted to 13.2, 7.02, and
5.53% of total manure N in the first, second, and third years
after manure application, respectively. The application of
manure allowed the application rate of chemical fertilizer N
to be decreased by 12–35% of that in the fertilizer plots. In
both plots (fertilizer plot and manure plot) at each site, net
ecosystem exchange (NEE) was measured by the eddy
covariance method (Hirata et al. 2013). The NECB in hay
meadow grasslands, which includes C input through manure
application and C output through crop harvest as well as
NEE, was estimated using the following equation:
NECB ¼ NEE À C applied in manure þ harvested C
Positive NECB represents C loss from the ecosystem.
The fluxes of CH 4 and N 2 O were measured by dark chamber
methods. (Relative to CO 2 , the GWP values with a 100-year
time horizon are 25 times greater for CH 4 and 298 times
greater for N 2 O.)
Table 5.21 N application rate
and sugar yield for each treatment
in three experiment fields
Field
Average N application rate
a
Sugar yield
b
VF (kgN
ha
−1
)
CF (kgN
ha
−1
)
Ratio (%;
VF/CF)
VF (t ha
−1 )
CF(tha
−1
)
Ratio (%;
VF/CF)
A
158
184
14.1
13.3 ± 0.7
12.2 ± 1.1
9.0
B
68
151
55.0
14.6
13.2
10.3
C
108
114
5.3
12.5 ± 0.6
11.7 ± 0.5
6.7
Average
111
150
24.8
13.5
12.4
8.7
Source (Niwa et al. 2016)
VF: Variable fertilizer application, CF: Conventional fertilizer application.
a VF: 120–200, 40–175, 80–140
kgN ha - 1 in field A, B, C, respectively, CF: Uniform fertilizer application.
b
Field A, C: Mean values for five
replicates ± standard deviation
174
T. Nakatsuji et al.