

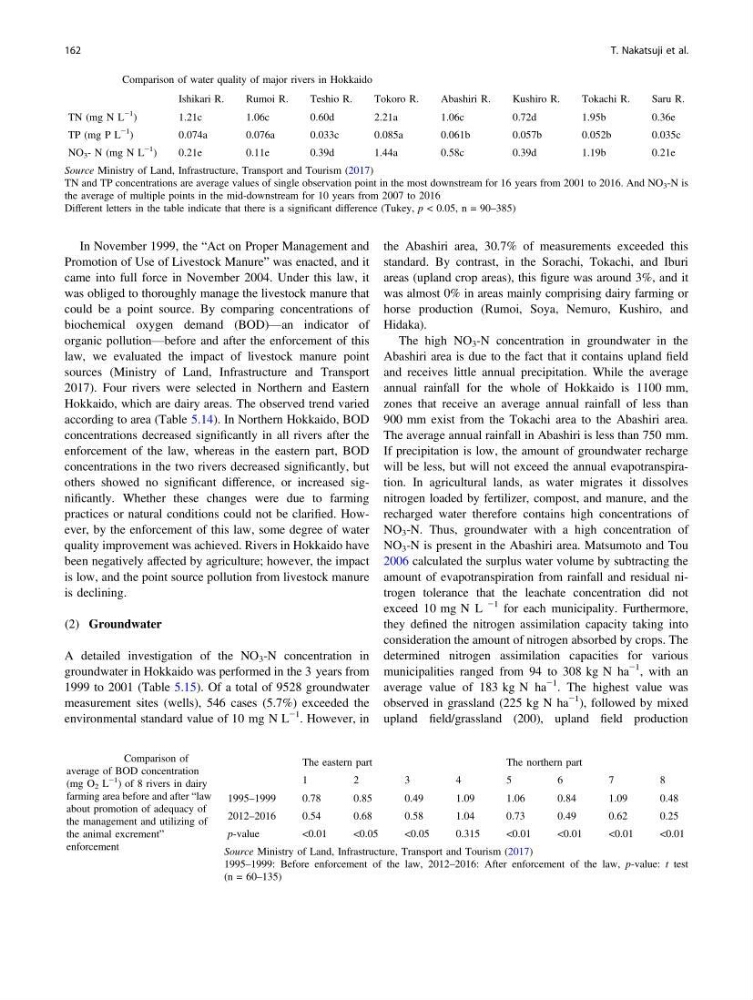
In November 1999, the “Act on Proper Management and
Promotion of Use of Livestock Manure” was enacted, and it
came into full force in November 2004. Under this law, it
was obliged to thoroughly manage the livestock manure that
could be a point source. By comparing concentrations of
biochemical oxygen demand (BOD)—an indicator of
organic pollution—before and after the enforcement of this
law, we evaluated the impact of livestock manure point
sources (Ministry of Land, Infrastructure and Transport
2017). Four rivers were selected in Northern and Eastern
Hokkaido, which are dairy areas. The observed trend varied
according to area (Table 5.14). In Northern Hokkaido, BOD
concentrations decreased significantly in all rivers after the
enforcement of the law, whereas in the eastern part, BOD
concentrations in the two rivers decreased significantly, but
others showed no significant difference, or increased significantly. Whether these changes were due to farming
practices or natural conditions could not be clarified. However, by the enforcement of this law, some degree of water
quality improvement was achieved. Rivers in Hokkaido have
been negatively affected by agriculture; however, the impact
is low, and the point source pollution from livestock manure
is declining.
(2) Groundwater
A detailed investigation of the NO 3 -N concentration in
groundwater in Hokkaido was performed in the 3 years from
1999 to 2001 (Table 5.15). Of a total of 9528 groundwater
measurement sites (wells), 546 cases (5.7%) exceeded the
environmental standard value of 10 mg N L
−1 . However, in
the Abashiri area, 30.7% of measurements exceeded this
standard. By contrast, in the Sorachi, Tokachi, and Iburi
areas (upland crop areas), this figure was around 3%, and it
was almost 0% in areas mainly comprising dairy farming or
horse production (Rumoi, Soya, Nemuro, Kushiro, and
Hidaka).
The high NO 3 -N concentration in groundwater in the
Abashiri area is due to the fact that it contains upland field
and receives little annual precipitation. While the average
annual rainfall for the whole of Hokkaido is 1100 mm,
zones that receive an average annual rainfall of less than
900 mm exist from the Tokachi area to the Abashiri area.
The average annual rainfall in Abashiri is less than 750 mm.
If precipitation is low, the amount of groundwater recharge
will be less, but will not exceed the annual evapotranspiration. In agricultural lands, as water migrates it dissolves
nitrogen loaded by fertilizer, compost, and manure, and the
recharged water therefore contains high concentrations of
NO 3 -N. Thus, groundwater with a high concentration of
NO 3 -N is present in the Abashiri area. Matsumoto and Tou
2006 calculated the surplus water volume by subtracting the
amount of evapotranspiration from rainfall and residual nitrogen tolerance that the leachate concentration did not
exceed 10 mg N L
−1 for each municipality. Furthermore,
they defined the nitrogen assimilation capacity taking into
consideration the amount of nitrogen absorbed by crops. The
determined nitrogen assimilation capacities for various
municipalities ranged from 94 to 308 kg N ha
−1 , with an
average value of 183 kg N ha
−1 . The highest value was
observed in grassland (225 kg N ha
−1 ), followed by mixed
upland field/grassland (200), upland field production
Table 5.13 Comparison of water quality of major rivers in Hokkaido
Ishikari R.
Rumoi R.
Teshio R.
Tokoro R.
Abashiri R.
Kushiro R.
Tokachi R.
Saru R.
TN (mg N L
−1
)
1.21c
1.06c
0.60d
2.21a
1.06c
0.72d
1.95b
0.36e
TP (mg P L
−1
)
0.074a
0.076a
0.033c
0.085a
0.061b
0.057b
0.052b
0.035c
NO 3 - N (mg N L
−1 )
0.21e
0.11e
0.39d
1.44a
0.58c
0.39d
1.19b
0.21e
Source Ministry of Land, Infrastructure, Transport and Tourism (2017)
TN and TP concentrations are average values of single observation point in the most downstream for 16 years from 2001 to 2016. And NO 3 -N is
the average of multiple points in the mid-downstream for 10 years from 2007 to 2016
Different letters in the table indicate that there is a significant difference (Tukey, p < 0.05, n = 90–385)
Table 5.14 Comparison of
average of BOD concentration
(mg O 2 L
−1
) of 8 rivers in dairy
farming area before and after “law
about promotion of adequacy of
the management and utilizing of
the animal excrement”
enforcement
The eastern part
The northern part
1
2
3
4
5
6
7
8
1995–1999
0.78
0.85
0.49
1.09
1.06
0.84
1.09
0.48
2012–2016
0.54
0.68
0.58
1.04
0.73
0.49
0.62
0.25
p-value
<0.01
<0.05
<0.05
0.315
<0.01
<0.01
<0.01
<0.01
Source Ministry of Land, Infrastructure, Transport and Tourism (2017)
1995–1999: Before enforcement of the law, 2012–2016: After enforcement of the law, p-value: t test
(n = 60–135)
162
T. Nakatsuji et al.
Promotion of Use of Livestock Manure” was enacted, and it
came into full force in November 2004. Under this law, it
was obliged to thoroughly manage the livestock manure that
could be a point source. By comparing concentrations of
biochemical oxygen demand (BOD)—an indicator of
organic pollution—before and after the enforcement of this
law, we evaluated the impact of livestock manure point
sources (Ministry of Land, Infrastructure and Transport
2017). Four rivers were selected in Northern and Eastern
Hokkaido, which are dairy areas. The observed trend varied
according to area (Table 5.14). In Northern Hokkaido, BOD
concentrations decreased significantly in all rivers after the
enforcement of the law, whereas in the eastern part, BOD
concentrations in the two rivers decreased significantly, but
others showed no significant difference, or increased significantly. Whether these changes were due to farming
practices or natural conditions could not be clarified. However, by the enforcement of this law, some degree of water
quality improvement was achieved. Rivers in Hokkaido have
been negatively affected by agriculture; however, the impact
is low, and the point source pollution from livestock manure
is declining.
(2) Groundwater
A detailed investigation of the NO 3 -N concentration in
groundwater in Hokkaido was performed in the 3 years from
1999 to 2001 (Table 5.15). Of a total of 9528 groundwater
measurement sites (wells), 546 cases (5.7%) exceeded the
environmental standard value of 10 mg N L
−1 . However, in
the Abashiri area, 30.7% of measurements exceeded this
standard. By contrast, in the Sorachi, Tokachi, and Iburi
areas (upland crop areas), this figure was around 3%, and it
was almost 0% in areas mainly comprising dairy farming or
horse production (Rumoi, Soya, Nemuro, Kushiro, and
Hidaka).
The high NO 3 -N concentration in groundwater in the
Abashiri area is due to the fact that it contains upland field
and receives little annual precipitation. While the average
annual rainfall for the whole of Hokkaido is 1100 mm,
zones that receive an average annual rainfall of less than
900 mm exist from the Tokachi area to the Abashiri area.
The average annual rainfall in Abashiri is less than 750 mm.
If precipitation is low, the amount of groundwater recharge
will be less, but will not exceed the annual evapotranspiration. In agricultural lands, as water migrates it dissolves
nitrogen loaded by fertilizer, compost, and manure, and the
recharged water therefore contains high concentrations of
NO 3 -N. Thus, groundwater with a high concentration of
NO 3 -N is present in the Abashiri area. Matsumoto and Tou
2006 calculated the surplus water volume by subtracting the
amount of evapotranspiration from rainfall and residual nitrogen tolerance that the leachate concentration did not
exceed 10 mg N L
−1 for each municipality. Furthermore,
they defined the nitrogen assimilation capacity taking into
consideration the amount of nitrogen absorbed by crops. The
determined nitrogen assimilation capacities for various
municipalities ranged from 94 to 308 kg N ha
−1 , with an
average value of 183 kg N ha
−1 . The highest value was
observed in grassland (225 kg N ha
−1 ), followed by mixed
upland field/grassland (200), upland field production
Table 5.13 Comparison of water quality of major rivers in Hokkaido
Ishikari R.
Rumoi R.
Teshio R.
Tokoro R.
Abashiri R.
Kushiro R.
Tokachi R.
Saru R.
TN (mg N L
−1
)
1.21c
1.06c
0.60d
2.21a
1.06c
0.72d
1.95b
0.36e
TP (mg P L
−1
)
0.074a
0.076a
0.033c
0.085a
0.061b
0.057b
0.052b
0.035c
NO 3 - N (mg N L
−1 )
0.21e
0.11e
0.39d
1.44a
0.58c
0.39d
1.19b
0.21e
Source Ministry of Land, Infrastructure, Transport and Tourism (2017)
TN and TP concentrations are average values of single observation point in the most downstream for 16 years from 2001 to 2016. And NO 3 -N is
the average of multiple points in the mid-downstream for 10 years from 2007 to 2016
Different letters in the table indicate that there is a significant difference (Tukey, p < 0.05, n = 90–385)
Table 5.14 Comparison of
average of BOD concentration
(mg O 2 L
−1
) of 8 rivers in dairy
farming area before and after “law
about promotion of adequacy of
the management and utilizing of
the animal excrement”
enforcement
The eastern part
The northern part
1
2
3
4
5
6
7
8
1995–1999
0.78
0.85
0.49
1.09
1.06
0.84
1.09
0.48
2012–2016
0.54
0.68
0.58
1.04
0.73
0.49
0.62
0.25
p-value
<0.01
<0.05
<0.05
0.315
<0.01
<0.01
<0.01
<0.01
Source Ministry of Land, Infrastructure, Transport and Tourism (2017)
1995–1999: Before enforcement of the law, 2012–2016: After enforcement of the law, p-value: t test
(n = 60–135)
162
T. Nakatsuji et al.