

(2) Impact to the water system
(1) Rivers
For this analysis, we used data from the water quality
hydrology database of the Ministry of Land, Infrastructure
and Transport (2017). Concentrations of total nitrogen (TN),
total phosphorus (TP), and nitrate nitrogen (NO 3 -N) in major
rivers in Hokkaido are summarized in Table 5.13. Concentrations of TN and TP are average values for a single
observation point in the most downstream area measured
over 16 years from 2001 to 2016. The concentrations of
NO 3 -N are averages of multiple observation points in the
mid-downstream area measured over 10 years from 2007 to
2016.
For various rivers, TN concentrations follow the order of
Tokoro > Tokachi > Ishikari = Abashiri = Rumoi >
Kushiro = Teshio > Saru. Concentrations were high in the
upland field areas (Tokoro and Tokachi Rivers), except for
the Abashiri River, had medium values in the paddy field
areas (Ishikari and Rumoi Rivers), and were low in the areas
of dairy farming and racehorse production (Kushiro, Teshio,
and Saru Rivers). Concentrations of TP were less than
0.09 mg P L
−1 in all rivers. In the upland field, the TP
concentration in the Tokoro River was the highest and was
moderate in the Tokachi River—0.09 mg P L
−1 . This is
probably due to the fact that the Tokachi River basin is
covered by Andosols with a high phosphate absorption
coefficient. Except for the Teshio River, TP concentrations
were low in Andosol areas (Abashiri, Kushiro, Tokachi, and
Saru Rivers), high in non-Andosols areas (Tokoro, Rumoi
and Ishikari Rivers). Concentrations of NO 3 -N were in the
range of 0.1–1.4 mg N L
−1 , in the order of Tokoro >
Tokachi > Abashiri > Kushiro = Teshio > Ishikari =
Saru = Rumoi. As for TN, NO 3 -N concentrations were the
highest upland fields, intermediate in paddy fields, and the
lowest in dairy farm areas.
Woli et al. (2002) measured the concentration of river
water NO 3 -N in various watersheds in Hokkaido and found a
positive linear relationship between the land use ratio in the
watersheds and the NO 3 -N concentration. They showed that
the slopes of the linear regression lines were large for upland
crops, open vegetable fields, and intensive livestock farming,
and small for areas of dairy farming and racehorse production. This indicates that agriculture affects river water quality
to a larger extent in upland fields, open vegetable fields and
intensive livestock farming, and to a smaller extent in areas
of dairy farming.
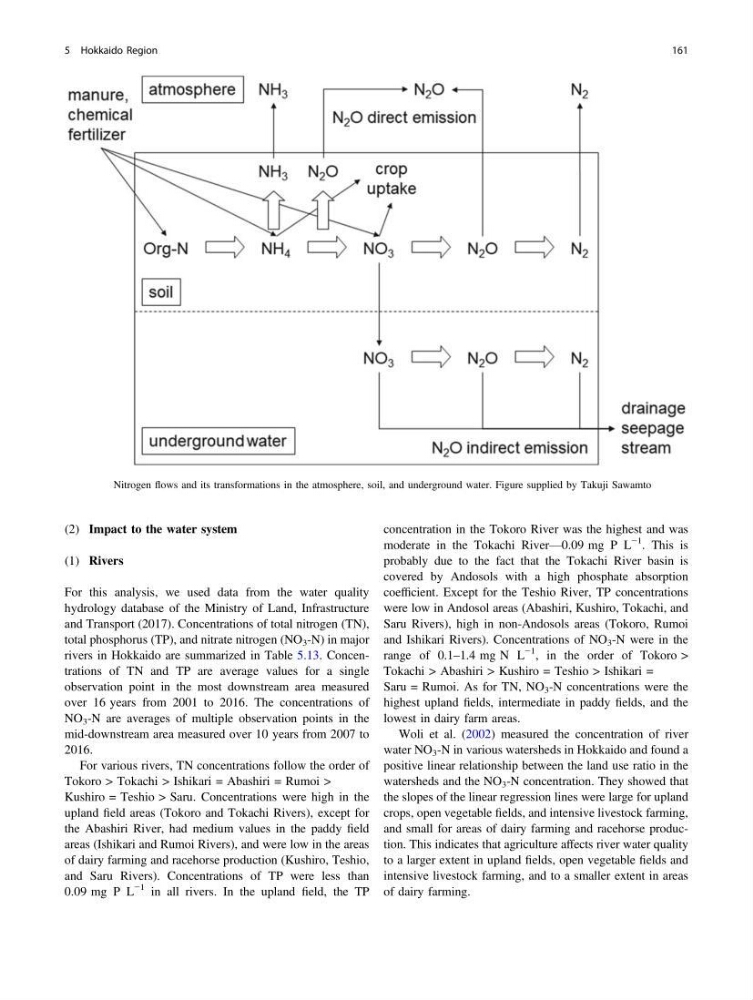
Fig. 5.10 Nitrogen flows and its transformations in the atmosphere, soil, and underground water. Figure supplied by Takuji Sawamto
5 Hokkaido Region
161
(1) Rivers
For this analysis, we used data from the water quality
hydrology database of the Ministry of Land, Infrastructure
and Transport (2017). Concentrations of total nitrogen (TN),
total phosphorus (TP), and nitrate nitrogen (NO 3 -N) in major
rivers in Hokkaido are summarized in Table 5.13. Concentrations of TN and TP are average values for a single
observation point in the most downstream area measured
over 16 years from 2001 to 2016. The concentrations of
NO 3 -N are averages of multiple observation points in the
mid-downstream area measured over 10 years from 2007 to
2016.
For various rivers, TN concentrations follow the order of
Tokoro > Tokachi > Ishikari = Abashiri = Rumoi >
Kushiro = Teshio > Saru. Concentrations were high in the
upland field areas (Tokoro and Tokachi Rivers), except for
the Abashiri River, had medium values in the paddy field
areas (Ishikari and Rumoi Rivers), and were low in the areas
of dairy farming and racehorse production (Kushiro, Teshio,
and Saru Rivers). Concentrations of TP were less than
0.09 mg P L
−1 in all rivers. In the upland field, the TP
concentration in the Tokoro River was the highest and was
moderate in the Tokachi River—0.09 mg P L
−1 . This is
probably due to the fact that the Tokachi River basin is
covered by Andosols with a high phosphate absorption
coefficient. Except for the Teshio River, TP concentrations
were low in Andosol areas (Abashiri, Kushiro, Tokachi, and
Saru Rivers), high in non-Andosols areas (Tokoro, Rumoi
and Ishikari Rivers). Concentrations of NO 3 -N were in the
range of 0.1–1.4 mg N L
−1 , in the order of Tokoro >
Tokachi > Abashiri > Kushiro = Teshio > Ishikari =
Saru = Rumoi. As for TN, NO 3 -N concentrations were the
highest upland fields, intermediate in paddy fields, and the
lowest in dairy farm areas.
Woli et al. (2002) measured the concentration of river
water NO 3 -N in various watersheds in Hokkaido and found a
positive linear relationship between the land use ratio in the
watersheds and the NO 3 -N concentration. They showed that
the slopes of the linear regression lines were large for upland
crops, open vegetable fields, and intensive livestock farming,
and small for areas of dairy farming and racehorse production. This indicates that agriculture affects river water quality
to a larger extent in upland fields, open vegetable fields and
intensive livestock farming, and to a smaller extent in areas
of dairy farming.
Fig. 5.10 Nitrogen flows and its transformations in the atmosphere, soil, and underground water. Figure supplied by Takuji Sawamto
5 Hokkaido Region
161