

The contents of fertilizer components in manure, slurries,
and the like vary significantly depending on their storage
method, storage time, methods of secondary processing, and
storage facility structure. Thus, it is recommended that
manure and slurries be analyzed before they are applied to
fields so that the application amount as well as the amount of
chemical fertilizers applied at the same time can be determined based on the actual nutrient content.
(2) Estimation for the fertilizer component of manure
Chemical analysis is the most accurate method for estimating the amount of fertilizer components in manure, but
because it involves specialized equipment, reagents, and
technicians, this technique is time-consuming and costly. As
a result, a method has been developed (Matsumoto et al.
2002) for estimating the total nitrogen (T-N), phosphorus,
potassium, and ammonia nitrogen (NH 4 -N) in manure by
measuring the electrical conductivity (EC, mS/cm) and dry
matter content (DM, weight%), which can be estimated
relatively easily in Hokkaido. Additionally, in the case of
slurries, it is possible to determine the dry matter content
from the specific gravity as a substitute for the drying
method, which requires a long time for measurement. Furthermore, the ammonia nitrogen content of manure can be
measured at a high level of precision by using a simple
reflective photometer (RQ flex, made by Merck).
(3) Environmental-friendly application of livestock
manure
Figure 5.6 shows a procedure for determining a converted
value for the actual amount of fertilizer applied to a grassland (Y, kg/t) from the fertilizer components of manure. If
analysis values are not available, standard values can be
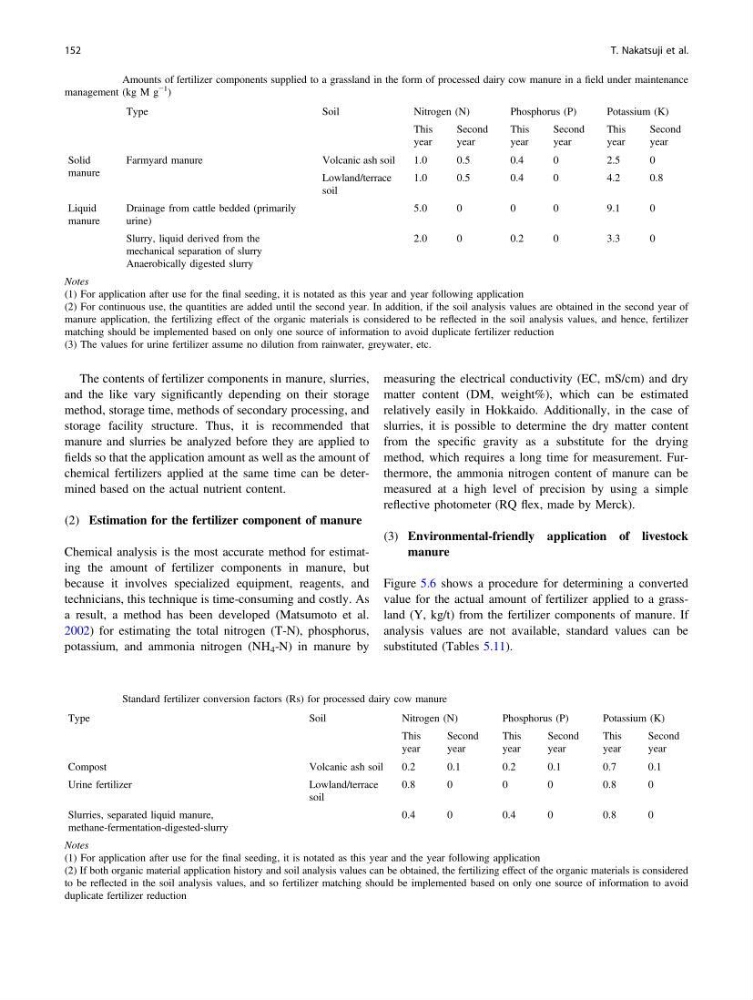
substituted (Tables 5.11).
Table 5.11 Amounts of fertilizer components supplied to a grassland in the form of processed dairy cow manure in a field under maintenance
management (kg M g
−1
)
Type
Soil
Nitrogen (N)
Phosphorus (P)
Potassium (K)
This
year
Second
year
This
year
Second
year
This
year
Second
year
Solid
manure
Farmyard manure
Volcanic ash soil
1.0
0.5
0.4
0
2.5
0
Lowland/terrace
soil
1.0
0.5
0.4
0
4.2
0.8
Liquid
manure
Drainage from cattle bedded (primarily
urine)
5.0
0
0
0
9.1
0
Slurry, liquid derived from the
mechanical separation of slurry
Anaerobically digested slurry
2.0
0
0.2
0
3.3
0
Notes
(1) For application after use for the final seeding, it is notated as this year and year following application
(2) For continuous use, the quantities are added until the second year. In addition, if the soil analysis values are obtained in the second year of
manure application, the fertilizing effect of the organic materials is considered to be reflected in the soil analysis values, and hence, fertilizer
matching should be implemented based on only one source of information to avoid duplicate fertilizer reduction
(3) The values for urine fertilizer assume no dilution from rainwater, greywater, etc.
Table 5.12 Standard fertilizer conversion factors (Rs) for processed dairy cow manure
Type
Soil
Nitrogen (N)
Phosphorus (P)
Potassium (K)
This
year
Second
year
This
year
Second
year
This
year
Second
year
Compost
Volcanic ash soil
0.2
0.1
0.2
0.1
0.7
0.1
Urine fertilizer
Lowland/terrace
soil
0.8
0
0
0
0.8
0
Slurries, separated liquid manure,
methane-fermentation-digested-slurry
0.4
0
0.4
0
0.8
0
Notes
(1) For application after use for the final seeding, it is notated as this year and the year following application
(2) If both organic material application history and soil analysis values can be obtained, the fertilizing effect of the organic materials is considered
to be reflected in the soil analysis values, and so fertilizer matching should be implemented based on only one source of information to avoid
duplicate fertilizer reduction
152
T. Nakatsuji et al.
and the like vary significantly depending on their storage
method, storage time, methods of secondary processing, and
storage facility structure. Thus, it is recommended that
manure and slurries be analyzed before they are applied to
fields so that the application amount as well as the amount of
chemical fertilizers applied at the same time can be determined based on the actual nutrient content.
(2) Estimation for the fertilizer component of manure
Chemical analysis is the most accurate method for estimating the amount of fertilizer components in manure, but
because it involves specialized equipment, reagents, and
technicians, this technique is time-consuming and costly. As
a result, a method has been developed (Matsumoto et al.
2002) for estimating the total nitrogen (T-N), phosphorus,
potassium, and ammonia nitrogen (NH 4 -N) in manure by
measuring the electrical conductivity (EC, mS/cm) and dry
matter content (DM, weight%), which can be estimated
relatively easily in Hokkaido. Additionally, in the case of
slurries, it is possible to determine the dry matter content
from the specific gravity as a substitute for the drying
method, which requires a long time for measurement. Furthermore, the ammonia nitrogen content of manure can be
measured at a high level of precision by using a simple
reflective photometer (RQ flex, made by Merck).
(3) Environmental-friendly application of livestock
manure
Figure 5.6 shows a procedure for determining a converted
value for the actual amount of fertilizer applied to a grassland (Y, kg/t) from the fertilizer components of manure. If
analysis values are not available, standard values can be
substituted (Tables 5.11).
Table 5.11 Amounts of fertilizer components supplied to a grassland in the form of processed dairy cow manure in a field under maintenance
management (kg M g
−1
)
Type
Soil
Nitrogen (N)
Phosphorus (P)
Potassium (K)
This
year
Second
year
This
year
Second
year
This
year
Second
year
Solid
manure
Farmyard manure
Volcanic ash soil
1.0
0.5
0.4
0
2.5
0
Lowland/terrace
soil
1.0
0.5
0.4
0
4.2
0.8
Liquid
manure
Drainage from cattle bedded (primarily
urine)
5.0
0
0
0
9.1
0
Slurry, liquid derived from the
mechanical separation of slurry
Anaerobically digested slurry
2.0
0
0.2
0
3.3
0
Notes
(1) For application after use for the final seeding, it is notated as this year and year following application
(2) For continuous use, the quantities are added until the second year. In addition, if the soil analysis values are obtained in the second year of
manure application, the fertilizing effect of the organic materials is considered to be reflected in the soil analysis values, and hence, fertilizer
matching should be implemented based on only one source of information to avoid duplicate fertilizer reduction
(3) The values for urine fertilizer assume no dilution from rainwater, greywater, etc.
Table 5.12 Standard fertilizer conversion factors (Rs) for processed dairy cow manure
Type
Soil
Nitrogen (N)
Phosphorus (P)
Potassium (K)
This
year
Second
year
This
year
Second
year
This
year
Second
year
Compost
Volcanic ash soil
0.2
0.1
0.2
0.1
0.7
0.1
Urine fertilizer
Lowland/terrace
soil
0.8
0
0
0
0.8
0
Slurries, separated liquid manure,
methane-fermentation-digested-slurry
0.4
0
0.4
0
0.8
0
Notes
(1) For application after use for the final seeding, it is notated as this year and the year following application
(2) If both organic material application history and soil analysis values can be obtained, the fertilizing effect of the organic materials is considered
to be reflected in the soil analysis values, and so fertilizer matching should be implemented based on only one source of information to avoid
duplicate fertilizer reduction
152
T. Nakatsuji et al.