

Rankings for Carbon Emissions and Economic Growth Decoupling
73
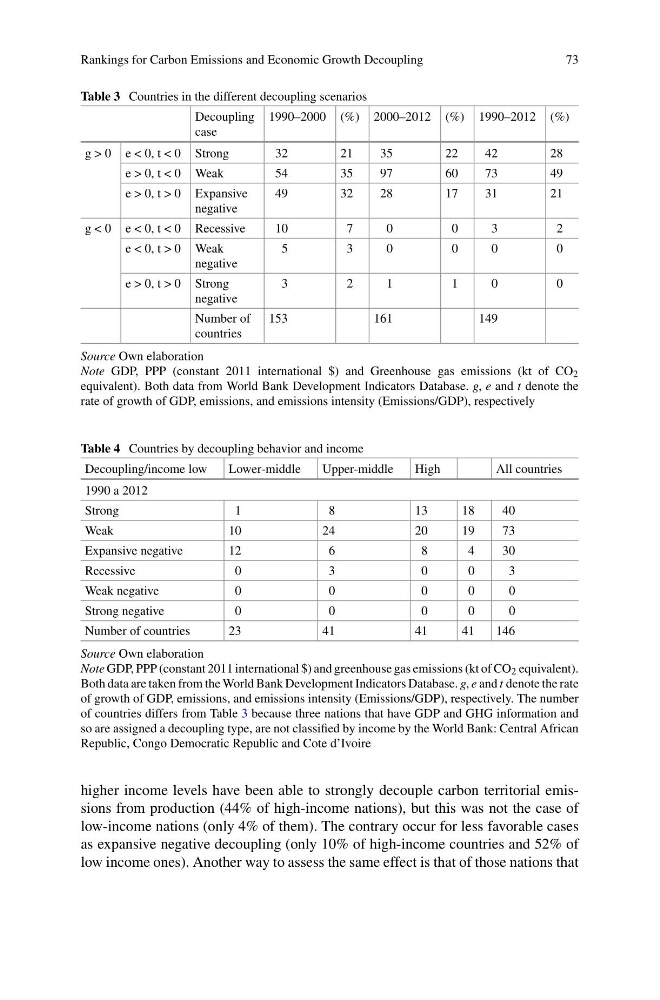
Table 3 Countries in the different decoupling scenarios
Decoupling
case
1990–2000 (%) 2000–2012 (%) 1990–2012 (%)
g > 0 e < 0, t < 0 Strong
32
21
35
22
42
28
e > 0, t < 0 Weak
54
35
97
60
73
49
e > 0, t > 0 Expansive
negative
49
32
28
17
31
21
g < 0 e < 0, t < 0 Recessive
10
7
0
0
3
2
e < 0, t > 0 Weak
negative
5
3
0
0
0
0
e > 0, t > 0 Strong
negative
3
2
1
1
0
0
Number of
countries
153
161
149
Source Own elaboration
Note GDP, PPP (constant 2011 international $) and Greenhouse gas emissions (kt of CO 2
equivalent). Both data from World Bank Development Indicators Database. g, e and t denote the
rate of growth of GDP, emissions, and emissions intensity (Emissions/GDP), respectively
Table 4 Countries by decoupling behavior and income
Decoupling/income low
Lower-middle
Upper-middle
High
All countries
1990 a 2012
Strong
1
8
13
18
40
Weak
10
24
20
19
73
Expansive negative
12
6
8
4
30
Recessive
0
3
0
0
3
Weak negative
0
0
0
0
0
Strong negative
0
0
0
0
0
Number of countries
23
41
41
41
146
Source Own elaboration
Note GDP, PPP (constant 2011 international $) and greenhouse gas emissions (kt of CO 2 equivalent).
Both data are taken from the World Bank Development Indicators Database. g, e and t denote the rate
of growth of GDP, emissions, and emissions intensity (Emissions/GDP), respectively. The number
of countries differs from Table 3 because three nations that have GDP and GHG information and
so are assigned a decoupling type, are not classified by income by the World Bank: Central African
Republic, Congo Democratic Republic and Cote d’Ivoire
higher income levels have been able to strongly decouple carbon territorial emissions from production (44% of high-income nations), but this was not the case of
low-income nations (only 4% of them). The contrary occur for less favorable cases
as expansive negative decoupling (only 10% of high-income countries and 52% of
low income ones). Another way to assess the same effect is that of those nations that
73
Table 3 Countries in the different decoupling scenarios
Decoupling
case
1990–2000 (%) 2000–2012 (%) 1990–2012 (%)
g > 0 e < 0, t < 0 Strong
32
21
35
22
42
28
e > 0, t < 0 Weak
54
35
97
60
73
49
e > 0, t > 0 Expansive
negative
49
32
28
17
31
21
g < 0 e < 0, t < 0 Recessive
10
7
0
0
3
2
e < 0, t > 0 Weak
negative
5
3
0
0
0
0
e > 0, t > 0 Strong
negative
3
2
1
1
0
0
Number of
countries
153
161
149
Source Own elaboration
Note GDP, PPP (constant 2011 international $) and Greenhouse gas emissions (kt of CO 2
equivalent). Both data from World Bank Development Indicators Database. g, e and t denote the
rate of growth of GDP, emissions, and emissions intensity (Emissions/GDP), respectively
Table 4 Countries by decoupling behavior and income
Decoupling/income low
Lower-middle
Upper-middle
High
All countries
1990 a 2012
Strong
1
8
13
18
40
Weak
10
24
20
19
73
Expansive negative
12
6
8
4
30
Recessive
0
3
0
0
3
Weak negative
0
0
0
0
0
Strong negative
0
0
0
0
0
Number of countries
23
41
41
41
146
Source Own elaboration
Note GDP, PPP (constant 2011 international $) and greenhouse gas emissions (kt of CO 2 equivalent).
Both data are taken from the World Bank Development Indicators Database. g, e and t denote the rate
of growth of GDP, emissions, and emissions intensity (Emissions/GDP), respectively. The number
of countries differs from Table 3 because three nations that have GDP and GHG information and
so are assigned a decoupling type, are not classified by income by the World Bank: Central African
Republic, Congo Democratic Republic and Cote d’Ivoire
higher income levels have been able to strongly decouple carbon territorial emissions from production (44% of high-income nations), but this was not the case of
low-income nations (only 4% of them). The contrary occur for less favorable cases
as expansive negative decoupling (only 10% of high-income countries and 52% of
low income ones). Another way to assess the same effect is that of those nations that