

72
M. Conte Grand
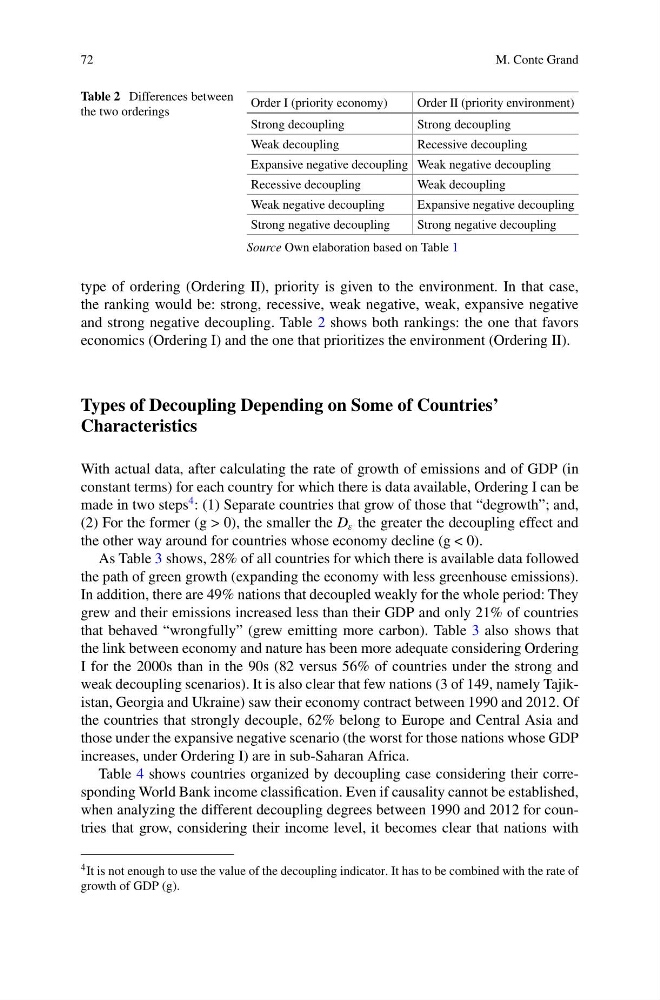
Table 2 Differences between
the two orderings
Order I (priority economy)
Order II (priority environment)
Strong decoupling
Strong decoupling
Weak decoupling
Recessive decoupling
Expansive negative decoupling Weak negative decoupling
Recessive decoupling
Weak decoupling
Weak negative decoupling
Expansive negative decoupling
Strong negative decoupling
Strong negative decoupling
Source Own elaboration based on Table 1
type of ordering (Ordering II), priority is given to the environment. In that case,
the ranking would be: strong, recessive, weak negative, weak, expansive negative
and strong negative decoupling. Table 2 shows both rankings: the one that favors
economics (Ordering I) and the one that prioritizes the environment (Ordering II).
Types of Decoupling Depending on Some of Countries’
Characteristics
With actual data, after calculating the rate of growth of emissions and of GDP (in
constant terms) for each country for which there is data available, Ordering I can be
made in two steps
4 : (1) Separate countries that grow of those that “degrowth”; and,
(2) For the former (g > 0), the smaller the D ε the greater the decoupling effect and
the other way around for countries whose economy decline (g < 0).
As Table 3 shows, 28% of all countries for which there is available data followed
the path of green growth (expanding the economy with less greenhouse emissions).
In addition, there are 49% nations that decoupled weakly for the whole period: They
grew and their emissions increased less than their GDP and only 21% of countries
that behaved “wrongfully” (grew emitting more carbon). Table 3 also shows that
the link between economy and nature has been more adequate considering Ordering
I for the 2000s than in the 90s (82 versus 56% of countries under the strong and
weak decoupling scenarios). It is also clear that few nations (3 of 149, namely Tajikistan, Georgia and Ukraine) saw their economy contract between 1990 and 2012. Of
the countries that strongly decouple, 62% belong to Europe and Central Asia and
those under the expansive negative scenario (the worst for those nations whose GDP
increases, under Ordering I) are in sub-Saharan Africa.
Table 4 shows countries organized by decoupling case considering their corresponding World Bank income classification. Even if causality cannot be established,
when analyzing the different decoupling degrees between 1990 and 2012 for countries that grow, considering their income level, it becomes clear that nations with
4 It is not enough to use the value of the decoupling indicator. It has to be combined with the rate of
growth of GDP (g).
M. Conte Grand
Table 2 Differences between
the two orderings
Order I (priority economy)
Order II (priority environment)
Strong decoupling
Strong decoupling
Weak decoupling
Recessive decoupling
Expansive negative decoupling Weak negative decoupling
Recessive decoupling
Weak decoupling
Weak negative decoupling
Expansive negative decoupling
Strong negative decoupling
Strong negative decoupling
Source Own elaboration based on Table 1
type of ordering (Ordering II), priority is given to the environment. In that case,
the ranking would be: strong, recessive, weak negative, weak, expansive negative
and strong negative decoupling. Table 2 shows both rankings: the one that favors
economics (Ordering I) and the one that prioritizes the environment (Ordering II).
Types of Decoupling Depending on Some of Countries’
Characteristics
With actual data, after calculating the rate of growth of emissions and of GDP (in
constant terms) for each country for which there is data available, Ordering I can be
made in two steps
4 : (1) Separate countries that grow of those that “degrowth”; and,
(2) For the former (g > 0), the smaller the D ε the greater the decoupling effect and
the other way around for countries whose economy decline (g < 0).
As Table 3 shows, 28% of all countries for which there is available data followed
the path of green growth (expanding the economy with less greenhouse emissions).
In addition, there are 49% nations that decoupled weakly for the whole period: They
grew and their emissions increased less than their GDP and only 21% of countries
that behaved “wrongfully” (grew emitting more carbon). Table 3 also shows that
the link between economy and nature has been more adequate considering Ordering
I for the 2000s than in the 90s (82 versus 56% of countries under the strong and
weak decoupling scenarios). It is also clear that few nations (3 of 149, namely Tajikistan, Georgia and Ukraine) saw their economy contract between 1990 and 2012. Of
the countries that strongly decouple, 62% belong to Europe and Central Asia and
those under the expansive negative scenario (the worst for those nations whose GDP
increases, under Ordering I) are in sub-Saharan Africa.
Table 4 shows countries organized by decoupling case considering their corresponding World Bank income classification. Even if causality cannot be established,
when analyzing the different decoupling degrees between 1990 and 2012 for countries that grow, considering their income level, it becomes clear that nations with
4 It is not enough to use the value of the decoupling indicator. It has to be combined with the rate of
growth of GDP (g).