

Rankings for Carbon Emissions and Economic Growth Decoupling
71
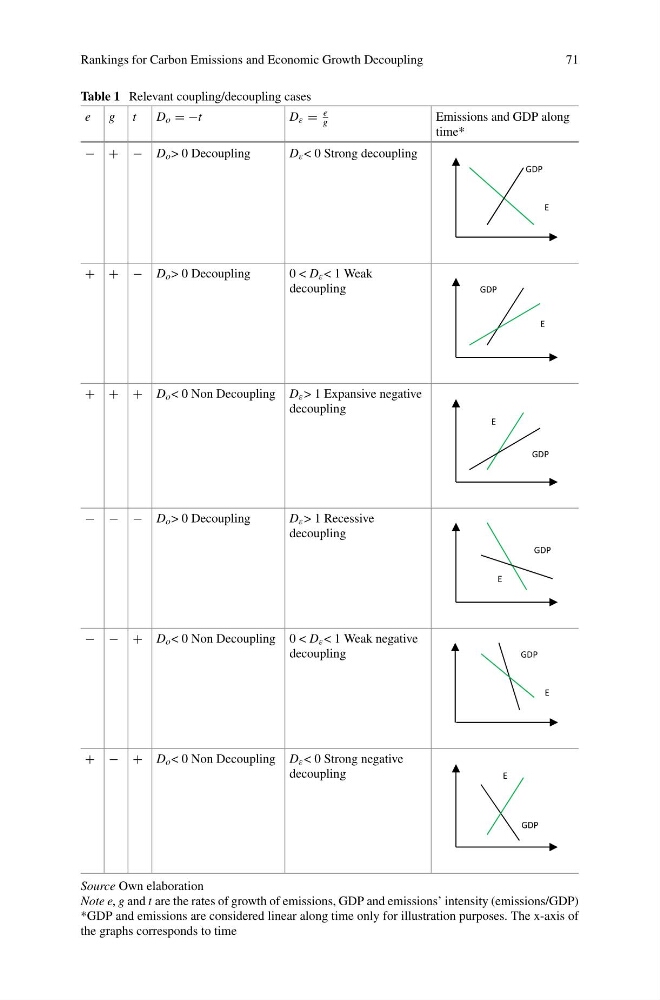
Table 1 Relevant coupling/decoupling cases
e g t
D o = −t
D ε =
e
g
Emissions and GDP along
time*
− + − D o > 0 Decoupling
D ε < 0 Strong decoupling
GDP
E
+ + − D o > 0 Decoupling
0 < D ε < 1 Weak
decoupling
GDP
E
+ + + D o < 0 Non Decoupling D ε > 1 Expansive negative
decoupling
E
GDP
− − − D o > 0 Decoupling
D ε > 1 Recessive
decoupling
GDP
E
− − + D o < 0 Non Decoupling 0 < D ε < 1 Weak negative
decoupling
GDP
E
+ − + D o < 0 Non Decoupling D ε < 0 Strong negative
decoupling
E
GDP
Source Own elaboration
Note e, g and t are the rates of growth of emissions, GDP and emissions’ intensity (emissions/GDP)
*GDP and emissions are considered linear along time only for illustration purposes. The x-axis of
the graphs corresponds to time
71
Table 1 Relevant coupling/decoupling cases
e g t
D o = −t
D ε =
e
g
Emissions and GDP along
time*
− + − D o > 0 Decoupling
D ε < 0 Strong decoupling
GDP
E
+ + − D o > 0 Decoupling
0 < D ε < 1 Weak
decoupling
GDP
E
+ + + D o < 0 Non Decoupling D ε > 1 Expansive negative
decoupling
E
GDP
− − − D o > 0 Decoupling
D ε > 1 Recessive
decoupling
GDP
E
− − + D o < 0 Non Decoupling 0 < D ε < 1 Weak negative
decoupling
GDP
E
+ − + D o < 0 Non Decoupling D ε < 0 Strong negative
decoupling
E
GDP
Source Own elaboration
Note e, g and t are the rates of growth of emissions, GDP and emissions’ intensity (emissions/GDP)
*GDP and emissions are considered linear along time only for illustration purposes. The x-axis of
the graphs corresponds to time