

Importantly PERS, which is the EcoPorts’ environmental standard and the only
port sector-specific environmental standard available, is well recognised and preferred by the sector. EcoPorts’ PERS is currently listed in a source of Good
International Industry Practices (GIIP) in the World Bank Group Environmental,
Health and Safety Guidelines for Ports, Harbors and Terminals and is recognised by
several other port organisations and associations including the American Association of Port Authorities (AAPA), the Taiwan International Port Corporation (TIPC),
the Port Management Association of West and Central Africa (PMAWCA) and the
Arab Sea Ports Federation (ASPF).
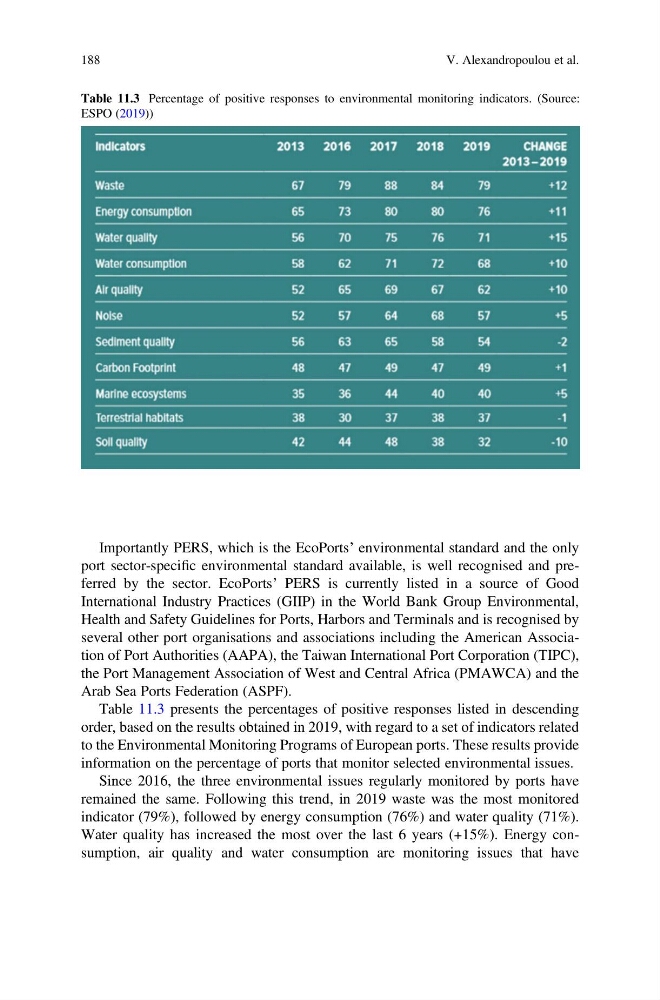
Table 11.3 presents the percentages of positive responses listed in descending
order, based on the results obtained in 2019, with regard to a set of indicators related
to the Environmental Monitoring Programs of European ports. These results provide
information on the percentage of ports that monitor selected environmental issues.
Since 2016, the three environmental issues regularly monitored by ports have
remained the same. Following this trend, in 2019 waste was the most monitored
indicator (79%), followed by energy consumption (76%) and water quality (71%).
Water quality has increased the most over the last 6 years (+15%). Energy consumption, air quality and water consumption are monitoring issues that have
Table 11.3 Percentage of positive responses to environmental monitoring indicators. (Source:
ESPO (2019))
188
V. Alexandropoulou et al.
port sector-specific environmental standard available, is well recognised and preferred by the sector. EcoPorts’ PERS is currently listed in a source of Good
International Industry Practices (GIIP) in the World Bank Group Environmental,
Health and Safety Guidelines for Ports, Harbors and Terminals and is recognised by
several other port organisations and associations including the American Association of Port Authorities (AAPA), the Taiwan International Port Corporation (TIPC),
the Port Management Association of West and Central Africa (PMAWCA) and the
Arab Sea Ports Federation (ASPF).
Table 11.3 presents the percentages of positive responses listed in descending
order, based on the results obtained in 2019, with regard to a set of indicators related
to the Environmental Monitoring Programs of European ports. These results provide
information on the percentage of ports that monitor selected environmental issues.
Since 2016, the three environmental issues regularly monitored by ports have
remained the same. Following this trend, in 2019 waste was the most monitored
indicator (79%), followed by energy consumption (76%) and water quality (71%).
Water quality has increased the most over the last 6 years (+15%). Energy consumption, air quality and water consumption are monitoring issues that have
Table 11.3 Percentage of positive responses to environmental monitoring indicators. (Source:
ESPO (2019))
188
V. Alexandropoulou et al.