

performance of a port, and it includes the percentage of positive responses to these
indicators for the year 2019 as well as for 2013, 2016, 2017 and 2018 in order to
analyse the variations over time.
Over the last years, the existence of an inventory of relevant environmental
legislation has been the indicator with the higher percentage of positive responses
demonstrating the awareness of ports about the requirement to comply with legislation. The indicator on the existence of an Environmental Policy (95%) follows in the
second position, evincing ports’ environmental commitment.
The definition of objectives and targets as well as the existence of an inventory of
significant environmental aspects (SEA) are elements that are present in most of the
ports (around 90%). These two indicators are the required first steps to start the
implementation of any environmental management system (EMS). Related to this,
the indicator on the existence of a certified environmental management system,
i.e. ISO 14001, EcoPorts’ PERS or EMAS has increased by 17% since 2013.
Consequently, ports are not only willing to implement an environmental management system but also commit to comply with the standards in order to be certified.
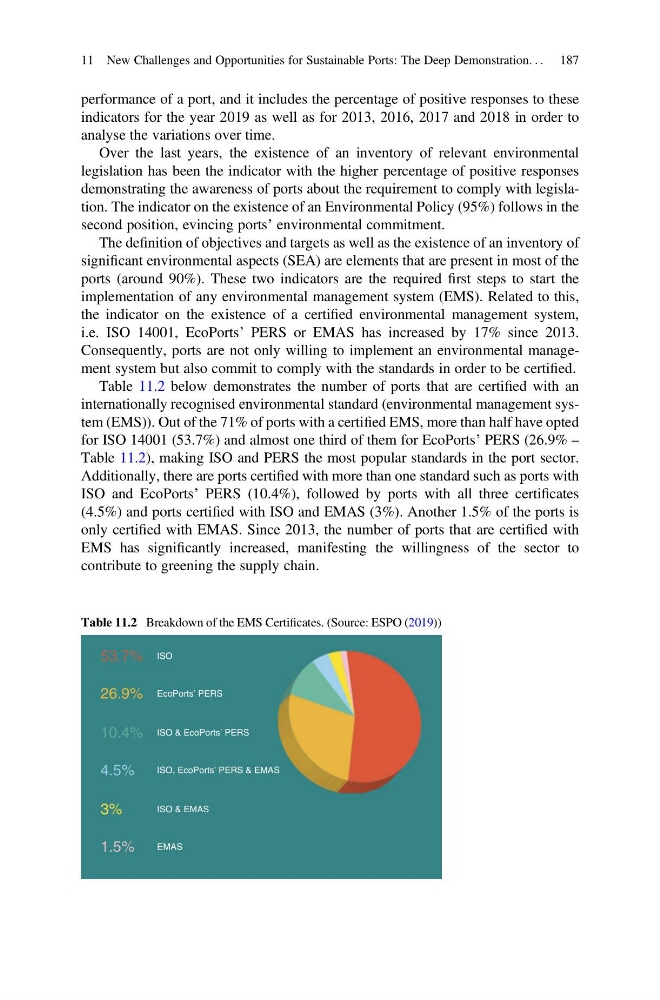
Table 11.2 below demonstrates the number of ports that are certified with an
internationally recognised environmental standard (environmental management system (EMS)). Out of the 71% of ports with a certified EMS, more than half have opted
for ISO 14001 (53.7%) and almost one third of them for EcoPorts’ PERS (26.9% –
Table 11.2), making ISO and PERS the most popular standards in the port sector.
Additionally, there are ports certified with more than one standard such as ports with
ISO and EcoPorts’ PERS (10.4%), followed by ports with all three certificates
(4.5%) and ports certified with ISO and EMAS (3%). Another 1.5% of the ports is
only certified with EMAS. Since 2013, the number of ports that are certified with
EMS has significantly increased, manifesting the willingness of the sector to
contribute to greening the supply chain.
Table 11.2 Breakdown of the EMS Certificates. (Source: ESPO (2019))
ISO
53.7%
26.9%
10.4%
4.5%
1.5%
3%
EcoPorts’ PERS
ISO & EcoPorts’ PERS
ISO, EcoPorts’ PERS & EMAS
ISO & EMAS
EMAS
11 New Challenges and Opportunities for Sustainable Ports: The Deep Demonstration. . . 187
indicators for the year 2019 as well as for 2013, 2016, 2017 and 2018 in order to
analyse the variations over time.
Over the last years, the existence of an inventory of relevant environmental
legislation has been the indicator with the higher percentage of positive responses
demonstrating the awareness of ports about the requirement to comply with legislation. The indicator on the existence of an Environmental Policy (95%) follows in the
second position, evincing ports’ environmental commitment.
The definition of objectives and targets as well as the existence of an inventory of
significant environmental aspects (SEA) are elements that are present in most of the
ports (around 90%). These two indicators are the required first steps to start the
implementation of any environmental management system (EMS). Related to this,
the indicator on the existence of a certified environmental management system,
i.e. ISO 14001, EcoPorts’ PERS or EMAS has increased by 17% since 2013.
Consequently, ports are not only willing to implement an environmental management system but also commit to comply with the standards in order to be certified.
Table 11.2 below demonstrates the number of ports that are certified with an
internationally recognised environmental standard (environmental management system (EMS)). Out of the 71% of ports with a certified EMS, more than half have opted
for ISO 14001 (53.7%) and almost one third of them for EcoPorts’ PERS (26.9% –
Table 11.2), making ISO and PERS the most popular standards in the port sector.
Additionally, there are ports certified with more than one standard such as ports with
ISO and EcoPorts’ PERS (10.4%), followed by ports with all three certificates
(4.5%) and ports certified with ISO and EMAS (3%). Another 1.5% of the ports is
only certified with EMAS. Since 2013, the number of ports that are certified with
EMS has significantly increased, manifesting the willingness of the sector to
contribute to greening the supply chain.
Table 11.2 Breakdown of the EMS Certificates. (Source: ESPO (2019))
ISO
53.7%
26.9%
10.4%
4.5%
1.5%
3%
EcoPorts’ PERS
ISO & EcoPorts’ PERS
ISO, EcoPorts’ PERS & EMAS
ISO & EMAS
EMAS
11 New Challenges and Opportunities for Sustainable Ports: The Deep Demonstration. . . 187