

to approximate the date that fish are ready for harvest. Growth depends upon the
quantity and quality of food ingested, as well as environmental factors such as sea
temperature, oxygen, currents, etc. In recent decades, the prediction of growth rate
and feed consumption of cultivated fish have gained increasing attention, and many
empirical models based on mathematical/statistical methods have been proposed.
Models can be used to estimate the growth and feed intake in terms of specific factors
rely on the experimental data and the experts’ knowledge (Petridis and Rogdakis
1996; Zhou et al. 2017; Jobling 2008; Mayer et al. 2008; Arnason et al. 2009).
A core output of the work within the BlueBRIDGE project, has been the creation
of models able to predict production indicators such as feed conversion rate (biological FCR), Feeding Rate (FR), and mortality rate based on the study of historical
production data. The models are established via the state-of-the-art regression
methods, such as generalized additive models (GAMs) and multivariate adaptive
regression splines (MARS). For each indicator the model with the highest accuracy
is employed in order to estimate the values of indicators in various growth levels
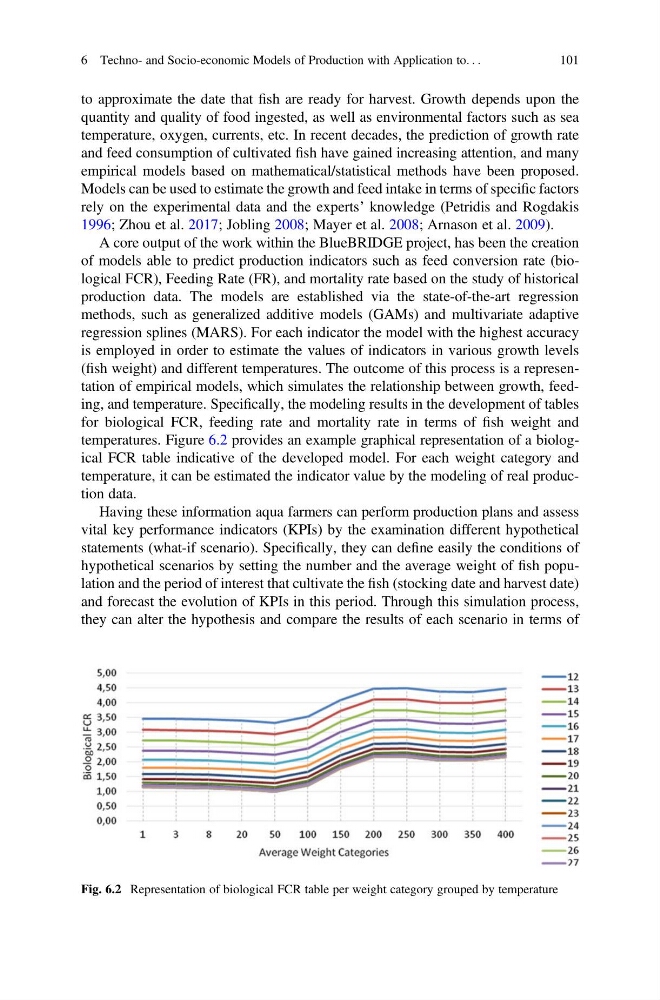
(fish weight) and different temperatures. The outcome of this process is a representation of empirical models, which simulates the relationship between growth, feeding, and temperature. Specifically, the modeling results in the development of tables
for biological FCR, feeding rate and mortality rate in terms of fish weight and
temperatures. Figure 6.2 provides an example graphical representation of a biological FCR table indicative of the developed model. For each weight category and
temperature, it can be estimated the indicator value by the modeling of real production data.
Having these information aqua farmers can perform production plans and assess
vital key performance indicators (KPIs) by the examination different hypothetical
statements (what-if scenario). Specifically, they can define easily the conditions of
hypothetical scenarios by setting the number and the average weight of fish population and the period of interest that cultivate the fish (stocking date and harvest date)
and forecast the evolution of KPIs in this period. Through this simulation process,
they can alter the hypothesis and compare the results of each scenario in terms of
Fig. 6.2 Representation of biological FCR table per weight category grouped by temperature
6 Techno- and Socio-economic Models of Production with Application to. . .
101
quantity and quality of food ingested, as well as environmental factors such as sea
temperature, oxygen, currents, etc. In recent decades, the prediction of growth rate
and feed consumption of cultivated fish have gained increasing attention, and many
empirical models based on mathematical/statistical methods have been proposed.
Models can be used to estimate the growth and feed intake in terms of specific factors
rely on the experimental data and the experts’ knowledge (Petridis and Rogdakis
1996; Zhou et al. 2017; Jobling 2008; Mayer et al. 2008; Arnason et al. 2009).
A core output of the work within the BlueBRIDGE project, has been the creation
of models able to predict production indicators such as feed conversion rate (biological FCR), Feeding Rate (FR), and mortality rate based on the study of historical
production data. The models are established via the state-of-the-art regression
methods, such as generalized additive models (GAMs) and multivariate adaptive
regression splines (MARS). For each indicator the model with the highest accuracy
is employed in order to estimate the values of indicators in various growth levels
(fish weight) and different temperatures. The outcome of this process is a representation of empirical models, which simulates the relationship between growth, feeding, and temperature. Specifically, the modeling results in the development of tables
for biological FCR, feeding rate and mortality rate in terms of fish weight and
temperatures. Figure 6.2 provides an example graphical representation of a biological FCR table indicative of the developed model. For each weight category and
temperature, it can be estimated the indicator value by the modeling of real production data.
Having these information aqua farmers can perform production plans and assess
vital key performance indicators (KPIs) by the examination different hypothetical
statements (what-if scenario). Specifically, they can define easily the conditions of
hypothetical scenarios by setting the number and the average weight of fish population and the period of interest that cultivate the fish (stocking date and harvest date)
and forecast the evolution of KPIs in this period. Through this simulation process,
they can alter the hypothesis and compare the results of each scenario in terms of
Fig. 6.2 Representation of biological FCR table per weight category grouped by temperature
6 Techno- and Socio-economic Models of Production with Application to. . .
101