

LTD Biological FCR, LTD Economical FCR, LTD SGR, LTD Growth, and LTD
Mortality. Simultaneously, they can benchmark their aqua farm performance against
the competition. The core idea behind benchmarking process is to provide a tool in
which aqua farmers can compare their farms’ performance against the performance
of other farms with similar characteristics in terms of the crucial KPIs without
sacrificing the confidentiality and privacy of their data. More specifically, using
Blue Economy tools, aqua farm managers achieve to estimate and benchmark the
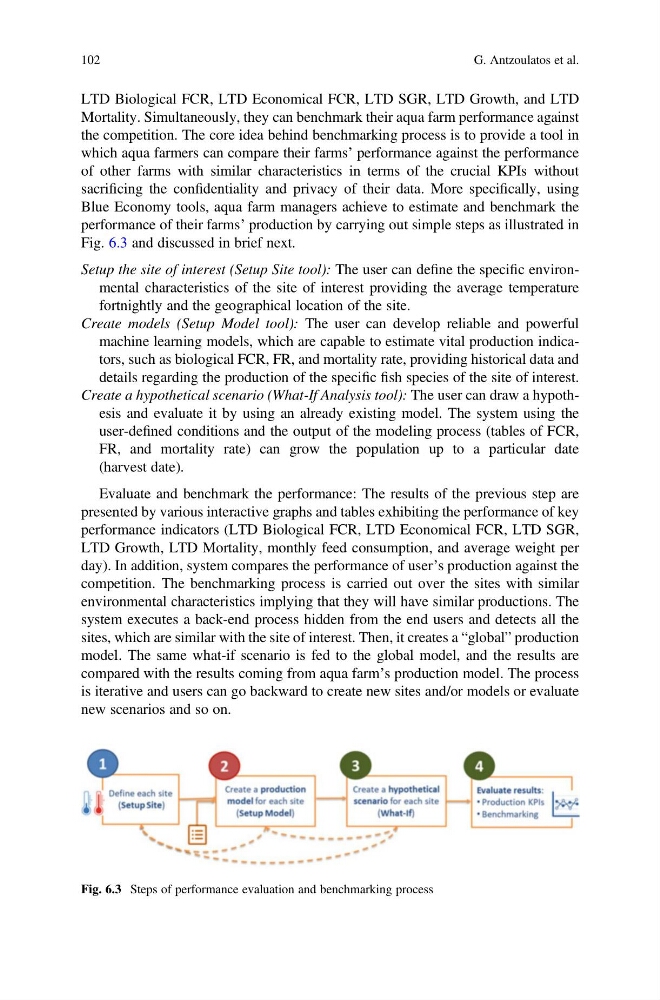
performance of their farms’ production by carrying out simple steps as illustrated in
Fig. 6.3 and discussed in brief next.
Setup the site of interest (Setup Site tool): The user can define the specific environmental characteristics of the site of interest providing the average temperature
fortnightly and the geographical location of the site.
Create models (Setup Model tool): The user can develop reliable and powerful
machine learning models, which are capable to estimate vital production indicators, such as biological FCR, FR, and mortality rate, providing historical data and
details regarding the production of the specific fish species of the site of interest.
Create a hypothetical scenario (What-If Analysis tool): The user can draw a hypothesis and evaluate it by using an already existing model. The system using the
user-defined conditions and the output of the modeling process (tables of FCR,
FR, and mortality rate) can grow the population up to a particular date
(harvest date).
Evaluate and benchmark the performance: The results of the previous step are
presented by various interactive graphs and tables exhibiting the performance of key
performance indicators (LTD Biological FCR, LTD Economical FCR, LTD SGR,
LTD Growth, LTD Mortality, monthly feed consumption, and average weight per
day). In addition, system compares the performance of user’s production against the
competition. The benchmarking process is carried out over the sites with similar
environmental characteristics implying that they will have similar productions. The
system executes a back-end process hidden from the end users and detects all the
sites, which are similar with the site of interest. Then, it creates a “global” production
model. The same what-if scenario is fed to the global model, and the results are
compared with the results coming from aqua farm’s production model. The process
is iterative and users can go backward to create new sites and/or models or evaluate
new scenarios and so on.
Fig. 6.3 Steps of performance evaluation and benchmarking process
102
G. Antzoulatos et al.
Mortality. Simultaneously, they can benchmark their aqua farm performance against
the competition. The core idea behind benchmarking process is to provide a tool in
which aqua farmers can compare their farms’ performance against the performance
of other farms with similar characteristics in terms of the crucial KPIs without
sacrificing the confidentiality and privacy of their data. More specifically, using
Blue Economy tools, aqua farm managers achieve to estimate and benchmark the
performance of their farms’ production by carrying out simple steps as illustrated in
Fig. 6.3 and discussed in brief next.
Setup the site of interest (Setup Site tool): The user can define the specific environmental characteristics of the site of interest providing the average temperature
fortnightly and the geographical location of the site.
Create models (Setup Model tool): The user can develop reliable and powerful
machine learning models, which are capable to estimate vital production indicators, such as biological FCR, FR, and mortality rate, providing historical data and
details regarding the production of the specific fish species of the site of interest.
Create a hypothetical scenario (What-If Analysis tool): The user can draw a hypothesis and evaluate it by using an already existing model. The system using the
user-defined conditions and the output of the modeling process (tables of FCR,
FR, and mortality rate) can grow the population up to a particular date
(harvest date).
Evaluate and benchmark the performance: The results of the previous step are
presented by various interactive graphs and tables exhibiting the performance of key
performance indicators (LTD Biological FCR, LTD Economical FCR, LTD SGR,
LTD Growth, LTD Mortality, monthly feed consumption, and average weight per
day). In addition, system compares the performance of user’s production against the
competition. The benchmarking process is carried out over the sites with similar
environmental characteristics implying that they will have similar productions. The
system executes a back-end process hidden from the end users and detects all the
sites, which are similar with the site of interest. Then, it creates a “global” production
model. The same what-if scenario is fed to the global model, and the results are
compared with the results coming from aqua farm’s production model. The process
is iterative and users can go backward to create new sites and/or models or evaluate
new scenarios and so on.
Fig. 6.3 Steps of performance evaluation and benchmarking process
102
G. Antzoulatos et al.