

5.4 Detailed Exposition of Risk Analysis
The tool materialized a streamlined robust methodology for the researchers/potential
decision-makers. This methodology included the data format and modeling in order
to be fed into the tool, as well as the decision-making process. The tool allowed for a
faster analysis, resulting in cost saving for the stakeholder. Due to the automation of
risk analysis, we were able to extend data analysis abilities to a larger and more
refined parameter space (Xepapadeas et al. 2017).
Monte Carlo simulations perform risk analysis by building models of possible
results by substituting a probability distribution for any factor that has inherent
uncertainty. It then calculates results over and over, each time using a different set
of random values from the probability functions. The basic idea for all the sites/
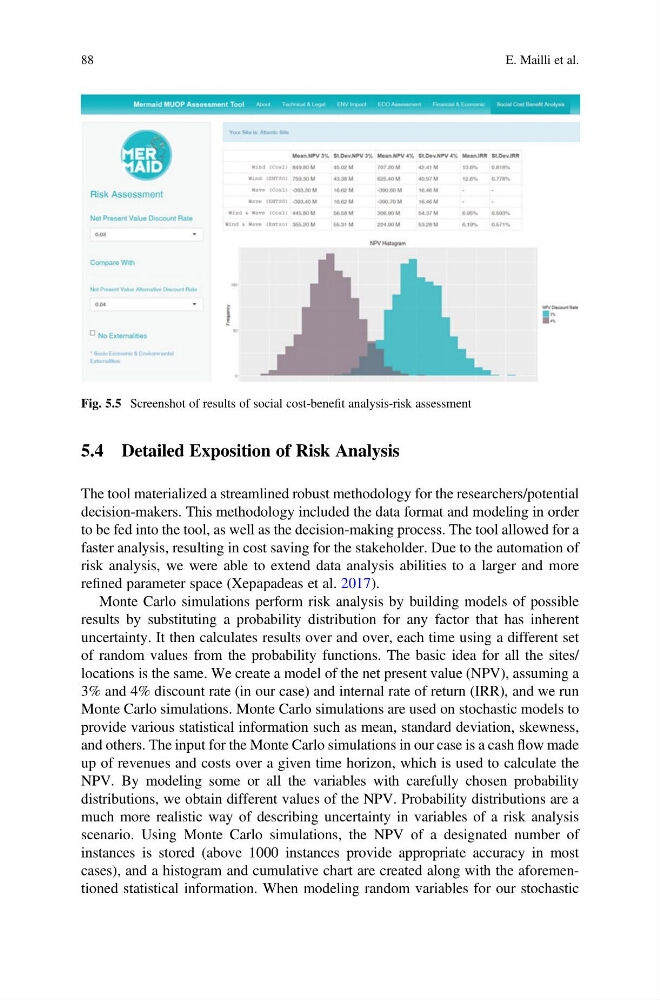
locations is the same. We create a model of the net present value (NPV), assuming a
3% and 4% discount rate (in our case) and internal rate of return (IRR), and we run
Monte Carlo simulations. Monte Carlo simulations are used on stochastic models to
provide various statistical information such as mean, standard deviation, skewness,
and others. The input for the Monte Carlo simulations in our case is a cash flow made
up of revenues and costs over a given time horizon, which is used to calculate the
NPV. By modeling some or all the variables with carefully chosen probability
distributions, we obtain different values of the NPV. Probability distributions are a
much more realistic way of describing uncertainty in variables of a risk analysis
scenario. Using Monte Carlo simulations, the NPV of a designated number of
instances is stored (above 1000 instances provide appropriate accuracy in most
cases), and a histogram and cumulative chart are created along with the aforementioned statistical information. When modeling random variables for our stochastic
Fig. 5.5 Screenshot of results of social cost-benefit analysis-risk assessment
88
E. Mailli et al.
The tool materialized a streamlined robust methodology for the researchers/potential
decision-makers. This methodology included the data format and modeling in order
to be fed into the tool, as well as the decision-making process. The tool allowed for a
faster analysis, resulting in cost saving for the stakeholder. Due to the automation of
risk analysis, we were able to extend data analysis abilities to a larger and more
refined parameter space (Xepapadeas et al. 2017).
Monte Carlo simulations perform risk analysis by building models of possible
results by substituting a probability distribution for any factor that has inherent
uncertainty. It then calculates results over and over, each time using a different set
of random values from the probability functions. The basic idea for all the sites/
locations is the same. We create a model of the net present value (NPV), assuming a
3% and 4% discount rate (in our case) and internal rate of return (IRR), and we run
Monte Carlo simulations. Monte Carlo simulations are used on stochastic models to
provide various statistical information such as mean, standard deviation, skewness,
and others. The input for the Monte Carlo simulations in our case is a cash flow made
up of revenues and costs over a given time horizon, which is used to calculate the
NPV. By modeling some or all the variables with carefully chosen probability
distributions, we obtain different values of the NPV. Probability distributions are a
much more realistic way of describing uncertainty in variables of a risk analysis
scenario. Using Monte Carlo simulations, the NPV of a designated number of
instances is stored (above 1000 instances provide appropriate accuracy in most
cases), and a histogram and cumulative chart are created along with the aforementioned statistical information. When modeling random variables for our stochastic
Fig. 5.5 Screenshot of results of social cost-benefit analysis-risk assessment
88
E. Mailli et al.