

model, we consider two factors. First, we should model temporal variables, such as
price, product output, etc. Second, our model distributions should be realistic;
otherwise, our model may yield meaningless results. If the distributions we chose
for our variables have no basis, then neither will the results of our models. For our
sites, therefore, we chose to use triangular and normal distributions. For example, the
triangular distribution was chosen, because in our data, we had three differing values
for the same variable; hence, the triangular distribution was used to take into account
all three values. In the sensitivity analysis for each site, we consider a base case for a
variable that affects the cash flows, and we perturb the base case within the range of a
maximum and minimum value. The sensitivity analysis calculates the net present
value (NPV) for alternative scenarios for the values of this variable in steps of 10%
increases from the maximum to the minimum, while the rest of the variables remain
constant at their base case values. Critical variables are those with a relatively high
slope in the NPV spider graph, and switching values are those in which NPV has a
value of zero. Below we give a general description of the approach we used for
each site.
5.4.1 North Sea Site
For the North Sea site, we had three platform uses that needed to be examined:
energy, mussels, seaweed, and combinations of the above.
5.4.1.1 Monte Carlo Simulation
• Triangular distribution was used in mussels investment, seaweed investment,
mussels operating cost, seaweed price, and seaweed operating cost.
• Normal distribution was used in energy output, mussels output, mussels price,
and seaweed output.
5.4.1.2 Sensitivity Analysis
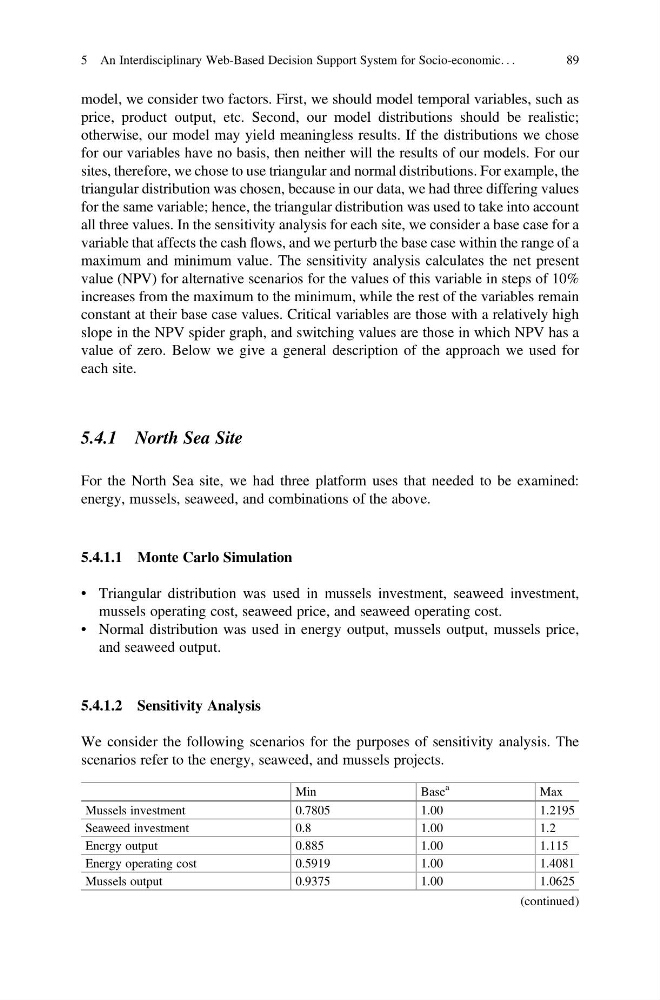
We consider the following scenarios for the purposes of sensitivity analysis. The
scenarios refer to the energy, seaweed, and mussels projects.
Min
Base
a
Max
Mussels investment
0.7805
1.00
1.2195
Seaweed investment
0.8
1.00
1.2
Energy output
0.885
1.00
1.115
Energy operating cost
0.5919
1.00
1.4081
Mussels output
0.9375
1.00
1.0625
(continued)
5 An Interdisciplinary Web-Based Decision Support System for Socio-economic. . .
89
price, product output, etc. Second, our model distributions should be realistic;
otherwise, our model may yield meaningless results. If the distributions we chose
for our variables have no basis, then neither will the results of our models. For our
sites, therefore, we chose to use triangular and normal distributions. For example, the
triangular distribution was chosen, because in our data, we had three differing values
for the same variable; hence, the triangular distribution was used to take into account
all three values. In the sensitivity analysis for each site, we consider a base case for a
variable that affects the cash flows, and we perturb the base case within the range of a
maximum and minimum value. The sensitivity analysis calculates the net present
value (NPV) for alternative scenarios for the values of this variable in steps of 10%
increases from the maximum to the minimum, while the rest of the variables remain
constant at their base case values. Critical variables are those with a relatively high
slope in the NPV spider graph, and switching values are those in which NPV has a
value of zero. Below we give a general description of the approach we used for
each site.
5.4.1 North Sea Site
For the North Sea site, we had three platform uses that needed to be examined:
energy, mussels, seaweed, and combinations of the above.
5.4.1.1 Monte Carlo Simulation
• Triangular distribution was used in mussels investment, seaweed investment,
mussels operating cost, seaweed price, and seaweed operating cost.
• Normal distribution was used in energy output, mussels output, mussels price,
and seaweed output.
5.4.1.2 Sensitivity Analysis
We consider the following scenarios for the purposes of sensitivity analysis. The
scenarios refer to the energy, seaweed, and mussels projects.
Min
Base
a
Max
Mussels investment
0.7805
1.00
1.2195
Seaweed investment
0.8
1.00
1.2
Energy output
0.885
1.00
1.115
Energy operating cost
0.5919
1.00
1.4081
Mussels output
0.9375
1.00
1.0625
(continued)
5 An Interdisciplinary Web-Based Decision Support System for Socio-economic. . .
89