

the irreversible environmental effects of the operation of the platforms. The table
below presents the questions posed to experts and researchers, including the set of
risks to be identified. The answers of the users, which should be based on an
Environmental Impact Assessment or Environmental Analysis undertaken during
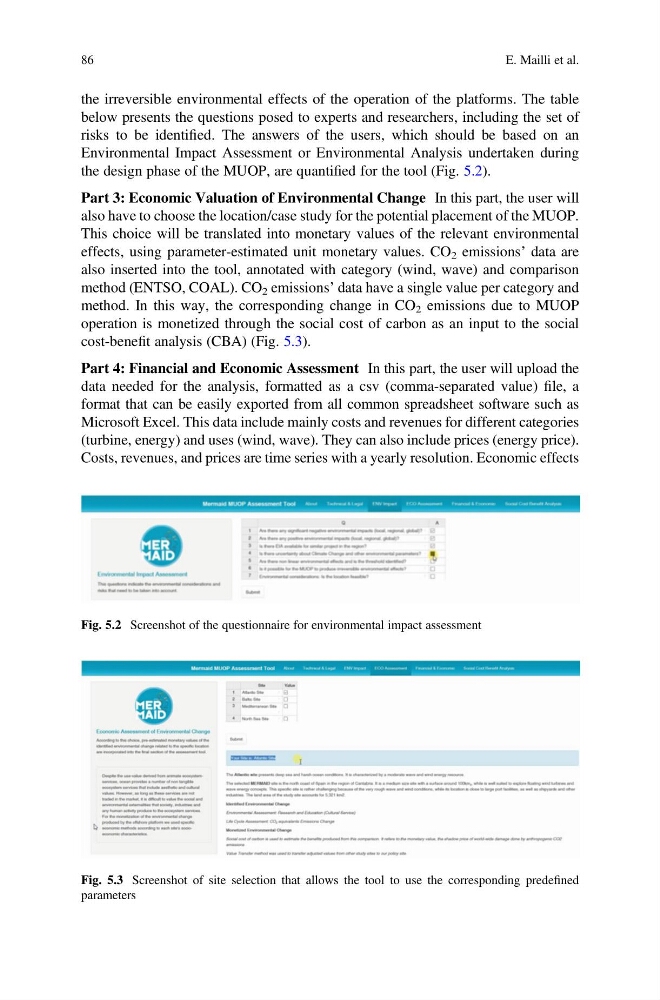
the design phase of the MUOP, are quantified for the tool (Fig. 5.2).
Part 3: Economic Valuation of Environmental Change In this part, the user will
also have to choose the location/case study for the potential placement of the MUOP.
This choice will be translated into monetary values of the relevant environmental
effects, using parameter-estimated unit monetary values. CO 2 emissions’ data are
also inserted into the tool, annotated with category (wind, wave) and comparison
method (ENTSO, COAL). CO 2 emissions’ data have a single value per category and
method. In this way, the corresponding change in CO 2 emissions due to MUOP
operation is monetized through the social cost of carbon as an input to the social
cost-benefit analysis (CBA) (Fig. 5.3).
Part 4: Financial and Economic Assessment In this part, the user will upload the
data needed for the analysis, formatted as a csv (comma-separated value) file, a
format that can be easily exported from all common spreadsheet software such as
Microsoft Excel. This data include mainly costs and revenues for different categories
(turbine, energy) and uses (wind, wave). They can also include prices (energy price).
Costs, revenues, and prices are time series with a yearly resolution. Economic effects
Fig. 5.2 Screenshot of the questionnaire for environmental impact assessment
Fig. 5.3 Screenshot of site selection that allows the tool to use the corresponding predefined
parameters
86
E. Mailli et al.
below presents the questions posed to experts and researchers, including the set of
risks to be identified. The answers of the users, which should be based on an
Environmental Impact Assessment or Environmental Analysis undertaken during
the design phase of the MUOP, are quantified for the tool (Fig. 5.2).
Part 3: Economic Valuation of Environmental Change In this part, the user will
also have to choose the location/case study for the potential placement of the MUOP.
This choice will be translated into monetary values of the relevant environmental
effects, using parameter-estimated unit monetary values. CO 2 emissions’ data are
also inserted into the tool, annotated with category (wind, wave) and comparison
method (ENTSO, COAL). CO 2 emissions’ data have a single value per category and
method. In this way, the corresponding change in CO 2 emissions due to MUOP
operation is monetized through the social cost of carbon as an input to the social
cost-benefit analysis (CBA) (Fig. 5.3).
Part 4: Financial and Economic Assessment In this part, the user will upload the
data needed for the analysis, formatted as a csv (comma-separated value) file, a
format that can be easily exported from all common spreadsheet software such as
Microsoft Excel. This data include mainly costs and revenues for different categories
(turbine, energy) and uses (wind, wave). They can also include prices (energy price).
Costs, revenues, and prices are time series with a yearly resolution. Economic effects
Fig. 5.2 Screenshot of the questionnaire for environmental impact assessment
Fig. 5.3 Screenshot of site selection that allows the tool to use the corresponding predefined
parameters
86
E. Mailli et al.