

• Construct Validity and Reliability: As the survey was
adapted from the UTAUT2 model, it was necessary to
reassess their reliability and validity in the context of higher
educational institutions. The reliability is the degree to
which data is error-free and therefore returns consistent
results. It can be inspected in terms of consistency and
stability of the results (McCullough & Best, 1979). In
general, three tests are used for assessing the reliability:
test-retest, internal-consistency, and alternative-forms (Peter,
1979). In the alternative-forms and test-retest, items of the
research must be administered to the same participants at
different times. To assess the internal-consistency, split-half
reliability methods and Cronbach’s coefficient alpha methods are used. However, the coefficient alpha is preferred
over the split-half model because the results of the split-half
model become unreliable when the numbers of items cannot
be divided into two halves (Green & Salkind, 2005).
According to Peter (1979), Cronbach’s coefficient alpha is
the most common and preferred method for evaluating the
reliability of measures. The coefficients of 0.7 or above are
generally considered an excellent value for reliability.
George & Mallery (2003) developed a rule to interpret the
Cronbach’s coefficient alpha as: <0.5 is unacceptable, >0.5
stands poor, >0.6 stands questionable, >0.7 stands acceptable, >0.8 is good, and alpha > 0.9 is an excellent value.
Step 4: Exploratory Factor Analysis (EFA)
EFA is a multi-variate statistical method that has various
uses, such as reduction of a great number of factors into a
small number of factors, establishing main dimensions
between latent and measured constructs, and offering the
evidence of construct validity of scales (Williams, Brown &
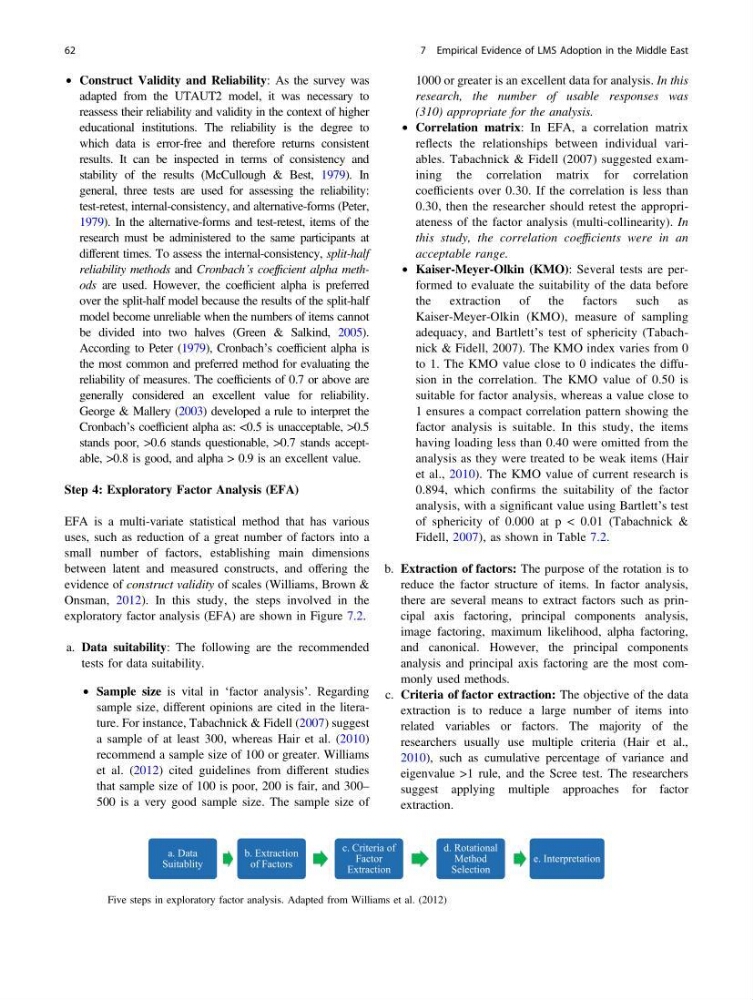
Onsman, 2012). In this study, the steps involved in the
exploratory factor analysis (EFA) are shown in Figure 7.2.
a. Data suitability: The following are the recommended
tests for data suitability.
• Sample size is vital in ‘factor analysis’. Regarding
sample size, different opinions are cited in the literature. For instance, Tabachnick & Fidell (2007) suggest
a sample of at least 300, whereas Hair et al. (2010)
recommend a sample size of 100 or greater. Williams
et al. (2012) cited guidelines from different studies
that sample size of 100 is poor, 200 is fair, and 300–
500 is a very good sample size. The sample size of
1000 or greater is an excellent data for analysis. In this
research, the number of usable responses was
(310) appropriate for the analysis.
• Correlation matrix: In EFA, a correlation matrix
reflects the relationships between individual variables. Tabachnick & Fidell (2007) suggested examining the correlation matrix for correlation
coefficients over 0.30. If the correlation is less than
0.30, then the researcher should retest the appropriateness of the factor analysis (multi-collinearity). In
this study, the correlation coefficients were in an
acceptable range.
• Kaiser-Meyer-Olkin (KMO): Several tests are performed to evaluate the suitability of the data before
the extraction of the factors such as
Kaiser-Meyer-Olkin (KMO), measure of sampling
adequacy, and Bartlett’s test of sphericity (Tabachnick & Fidell, 2007). The KMO index varies from 0
to 1. The KMO value close to 0 indicates the diffusion in the correlation. The KMO value of 0.50 is
suitable for factor analysis, whereas a value close to
1 ensures a compact correlation pattern showing the
factor analysis is suitable. In this study, the items
having loading less than 0.40 were omitted from the
analysis as they were treated to be weak items (Hair
et al., 2010). The KMO value of current research is
0.894, which confirms the suitability of the factor
analysis, with a significant value using Bartlett’s test
of sphericity of 0.000 at p < 0.01 (Tabachnick &
Fidell, 2007), as shown in Table 7.2.
b. Extraction of factors: The purpose of the rotation is to
reduce the factor structure of items. In factor analysis,
there are several means to extract factors such as principal axis factoring, principal components analysis,
image factoring, maximum likelihood, alpha factoring,
and canonical. However, the principal components
analysis and principal axis factoring are the most commonly used methods.
c. Criteria of factor extraction: The objective of the data
extraction is to reduce a large number of items into
related variables or factors. The majority of the
researchers usually use multiple criteria (Hair et al.,
2010), such as cumulative percentage of variance and
eigenvalue >1 rule, and the Scree test. The researchers
suggest applying multiple approaches for factor
extraction.
a. Data
Suitablity
b. Extraction
of Factors
c. Criteria of
Factor
Extraction
d. Rotational
Method
Selection
e. Interpretation
Fig. 7.2 Five steps in exploratory factor analysis. Adapted from Williams et al. (2012)
62
7 Empirical Evidence of LMS Adoption in the Middle East
adapted from the UTAUT2 model, it was necessary to
reassess their reliability and validity in the context of higher
educational institutions. The reliability is the degree to
which data is error-free and therefore returns consistent
results. It can be inspected in terms of consistency and
stability of the results (McCullough & Best, 1979). In
general, three tests are used for assessing the reliability:
test-retest, internal-consistency, and alternative-forms (Peter,
1979). In the alternative-forms and test-retest, items of the
research must be administered to the same participants at
different times. To assess the internal-consistency, split-half
reliability methods and Cronbach’s coefficient alpha methods are used. However, the coefficient alpha is preferred
over the split-half model because the results of the split-half
model become unreliable when the numbers of items cannot
be divided into two halves (Green & Salkind, 2005).
According to Peter (1979), Cronbach’s coefficient alpha is
the most common and preferred method for evaluating the
reliability of measures. The coefficients of 0.7 or above are
generally considered an excellent value for reliability.
George & Mallery (2003) developed a rule to interpret the
Cronbach’s coefficient alpha as: <0.5 is unacceptable, >0.5
stands poor, >0.6 stands questionable, >0.7 stands acceptable, >0.8 is good, and alpha > 0.9 is an excellent value.
Step 4: Exploratory Factor Analysis (EFA)
EFA is a multi-variate statistical method that has various
uses, such as reduction of a great number of factors into a
small number of factors, establishing main dimensions
between latent and measured constructs, and offering the
evidence of construct validity of scales (Williams, Brown &
Onsman, 2012). In this study, the steps involved in the
exploratory factor analysis (EFA) are shown in Figure 7.2.
a. Data suitability: The following are the recommended
tests for data suitability.
• Sample size is vital in ‘factor analysis’. Regarding
sample size, different opinions are cited in the literature. For instance, Tabachnick & Fidell (2007) suggest
a sample of at least 300, whereas Hair et al. (2010)
recommend a sample size of 100 or greater. Williams
et al. (2012) cited guidelines from different studies
that sample size of 100 is poor, 200 is fair, and 300–
500 is a very good sample size. The sample size of
1000 or greater is an excellent data for analysis. In this
research, the number of usable responses was
(310) appropriate for the analysis.
• Correlation matrix: In EFA, a correlation matrix
reflects the relationships between individual variables. Tabachnick & Fidell (2007) suggested examining the correlation matrix for correlation
coefficients over 0.30. If the correlation is less than
0.30, then the researcher should retest the appropriateness of the factor analysis (multi-collinearity). In
this study, the correlation coefficients were in an
acceptable range.
• Kaiser-Meyer-Olkin (KMO): Several tests are performed to evaluate the suitability of the data before
the extraction of the factors such as
Kaiser-Meyer-Olkin (KMO), measure of sampling
adequacy, and Bartlett’s test of sphericity (Tabachnick & Fidell, 2007). The KMO index varies from 0
to 1. The KMO value close to 0 indicates the diffusion in the correlation. The KMO value of 0.50 is
suitable for factor analysis, whereas a value close to
1 ensures a compact correlation pattern showing the
factor analysis is suitable. In this study, the items
having loading less than 0.40 were omitted from the
analysis as they were treated to be weak items (Hair
et al., 2010). The KMO value of current research is
0.894, which confirms the suitability of the factor
analysis, with a significant value using Bartlett’s test
of sphericity of 0.000 at p < 0.01 (Tabachnick &
Fidell, 2007), as shown in Table 7.2.
b. Extraction of factors: The purpose of the rotation is to
reduce the factor structure of items. In factor analysis,
there are several means to extract factors such as principal axis factoring, principal components analysis,
image factoring, maximum likelihood, alpha factoring,
and canonical. However, the principal components
analysis and principal axis factoring are the most commonly used methods.
c. Criteria of factor extraction: The objective of the data
extraction is to reduce a large number of items into
related variables or factors. The majority of the
researchers usually use multiple criteria (Hair et al.,
2010), such as cumulative percentage of variance and
eigenvalue >1 rule, and the Scree test. The researchers
suggest applying multiple approaches for factor
extraction.
a. Data
Suitablity
b. Extraction
of Factors
c. Criteria of
Factor
Extraction
d. Rotational
Method
Selection
e. Interpretation
Fig. 7.2 Five steps in exploratory factor analysis. Adapted from Williams et al. (2012)
62
7 Empirical Evidence of LMS Adoption in the Middle East