

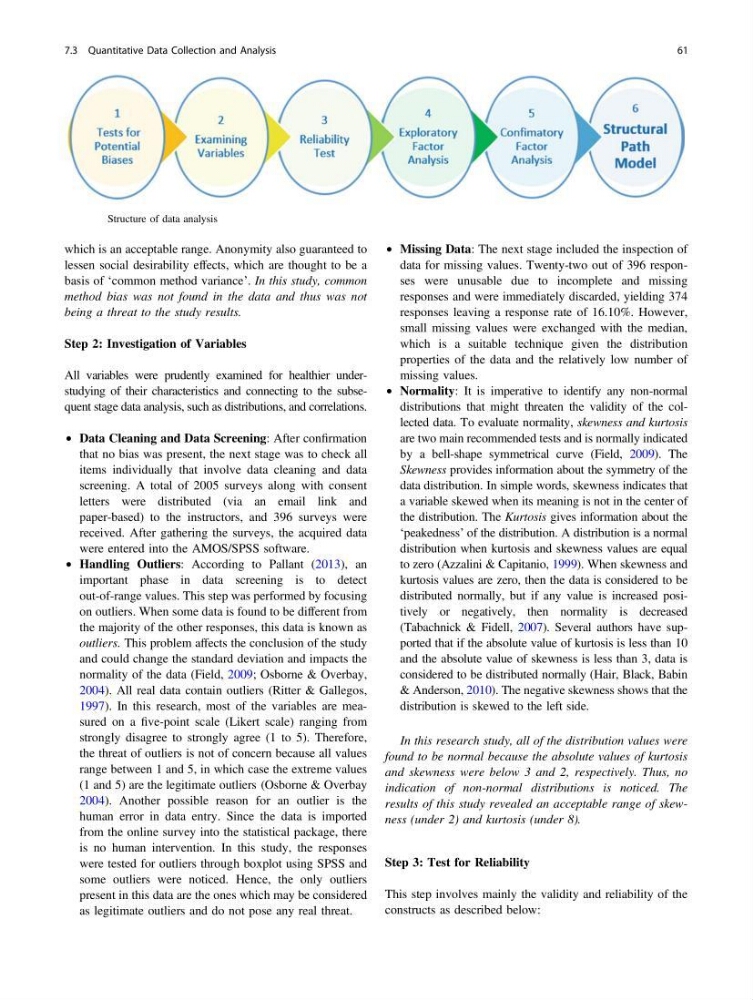
Fig. 7.1 Structure of data analysis
which is an acceptable range. Anonymity also guaranteed to
lessen social desirability effects, which are thought to be a
basis of ‘common method variance’. In this study, common
method bias was not found in the data and thus was not
being a threat to the study results.
Step 2: Investigation of Variables
All variables were prudently examined for healthier understudying of their characteristics and connecting to the subsequent stage data analysis, such as distributions, and correlations.
• Data Cleaning and Data Screening: After confirmation
that no bias was present, the next stage was to check all
items individually that involve data cleaning and data
screening. A total of 2005 surveys along with consent
letters were distributed (via an email link and
paper-based) to the instructors, and 396 surveys were
received. After gathering the surveys, the acquired data
were entered into the AMOS/SPSS software.
• Handling Outliers: According to Pallant (2013), an
important phase in data screening is to detect
out-of-range values. This step was performed by focusing
on outliers. When some data is found to be different from
the majority of the other responses, this data is known as
outliers. This problem affects the conclusion of the study
and could change the standard deviation and impacts the
normality of the data (Field, 2009; Osborne & Overbay,
2004). All real data contain outliers (Ritter & Gallegos,
1997). In this research, most of the variables are measured on a five-point scale (Likert scale) ranging from
strongly disagree to strongly agree (1 to 5). Therefore,
the threat of outliers is not of concern because all values
range between 1 and 5, in which case the extreme values
(1 and 5) are the legitimate outliers (Osborne & Overbay
2004). Another possible reason for an outlier is the
human error in data entry. Since the data is imported
from the online survey into the statistical package, there
is no human intervention. In this study, the responses
were tested for outliers through boxplot using SPSS and
some outliers were noticed. Hence, the only outliers
present in this data are the ones which may be considered
as legitimate outliers and do not pose any real threat.
• Missing Data: The next stage included the inspection of
data for missing values. Twenty-two out of 396 responses were unusable due to incomplete and missing
responses and were immediately discarded, yielding 374
responses leaving a response rate of 16.10%. However,
small missing values were exchanged with the median,
which is a suitable technique given the distribution
properties of the data and the relatively low number of
missing values.
• Normality: It is imperative to identify any non-normal
distributions that might threaten the validity of the collected data. To evaluate normality, skewness and kurtosis
are two main recommended tests and is normally indicated
by a bell-shape symmetrical curve (Field, 2009). The
Skewness provides information about the symmetry of the
data distribution. In simple words, skewness indicates that
a variable skewed when its meaning is not in the center of
the distribution. The Kurtosis gives information about the
‘peakedness’ of the distribution. A distribution is a normal
distribution when kurtosis and skewness values are equal
to zero (Azzalini & Capitanio, 1999). When skewness and
kurtosis values are zero, then the data is considered to be
distributed normally, but if any value is increased positively or negatively, then normality is decreased
(Tabachnick & Fidell, 2007). Several authors have supported that if the absolute value of kurtosis is less than 10
and the absolute value of skewness is less than 3, data is
considered to be distributed normally (Hair, Black, Babin
& Anderson, 2010). The negative skewness shows that the
distribution is skewed to the left side.
In this research study, all of the distribution values were
found to be normal because the absolute values of kurtosis
and skewness were below 3 and 2, respectively. Thus, no
indication of non-normal distributions is noticed. The
results of this study revealed an acceptable range of skewness (under 2) and kurtosis (under 8).
Step 3: Test for Reliability
This step involves mainly the validity and reliability of the
constructs as described below:
7.3 Quantitative Data Collection and Analysis
61
which is an acceptable range. Anonymity also guaranteed to
lessen social desirability effects, which are thought to be a
basis of ‘common method variance’. In this study, common
method bias was not found in the data and thus was not
being a threat to the study results.
Step 2: Investigation of Variables
All variables were prudently examined for healthier understudying of their characteristics and connecting to the subsequent stage data analysis, such as distributions, and correlations.
• Data Cleaning and Data Screening: After confirmation
that no bias was present, the next stage was to check all
items individually that involve data cleaning and data
screening. A total of 2005 surveys along with consent
letters were distributed (via an email link and
paper-based) to the instructors, and 396 surveys were
received. After gathering the surveys, the acquired data
were entered into the AMOS/SPSS software.
• Handling Outliers: According to Pallant (2013), an
important phase in data screening is to detect
out-of-range values. This step was performed by focusing
on outliers. When some data is found to be different from
the majority of the other responses, this data is known as
outliers. This problem affects the conclusion of the study
and could change the standard deviation and impacts the
normality of the data (Field, 2009; Osborne & Overbay,
2004). All real data contain outliers (Ritter & Gallegos,
1997). In this research, most of the variables are measured on a five-point scale (Likert scale) ranging from
strongly disagree to strongly agree (1 to 5). Therefore,
the threat of outliers is not of concern because all values
range between 1 and 5, in which case the extreme values
(1 and 5) are the legitimate outliers (Osborne & Overbay
2004). Another possible reason for an outlier is the
human error in data entry. Since the data is imported
from the online survey into the statistical package, there
is no human intervention. In this study, the responses
were tested for outliers through boxplot using SPSS and
some outliers were noticed. Hence, the only outliers
present in this data are the ones which may be considered
as legitimate outliers and do not pose any real threat.
• Missing Data: The next stage included the inspection of
data for missing values. Twenty-two out of 396 responses were unusable due to incomplete and missing
responses and were immediately discarded, yielding 374
responses leaving a response rate of 16.10%. However,
small missing values were exchanged with the median,
which is a suitable technique given the distribution
properties of the data and the relatively low number of
missing values.
• Normality: It is imperative to identify any non-normal
distributions that might threaten the validity of the collected data. To evaluate normality, skewness and kurtosis
are two main recommended tests and is normally indicated
by a bell-shape symmetrical curve (Field, 2009). The
Skewness provides information about the symmetry of the
data distribution. In simple words, skewness indicates that
a variable skewed when its meaning is not in the center of
the distribution. The Kurtosis gives information about the
‘peakedness’ of the distribution. A distribution is a normal
distribution when kurtosis and skewness values are equal
to zero (Azzalini & Capitanio, 1999). When skewness and
kurtosis values are zero, then the data is considered to be
distributed normally, but if any value is increased positively or negatively, then normality is decreased
(Tabachnick & Fidell, 2007). Several authors have supported that if the absolute value of kurtosis is less than 10
and the absolute value of skewness is less than 3, data is
considered to be distributed normally (Hair, Black, Babin
& Anderson, 2010). The negative skewness shows that the
distribution is skewed to the left side.
In this research study, all of the distribution values were
found to be normal because the absolute values of kurtosis
and skewness were below 3 and 2, respectively. Thus, no
indication of non-normal distributions is noticed. The
results of this study revealed an acceptable range of skewness (under 2) and kurtosis (under 8).
Step 3: Test for Reliability
This step involves mainly the validity and reliability of the
constructs as described below:
7.3 Quantitative Data Collection and Analysis
61