

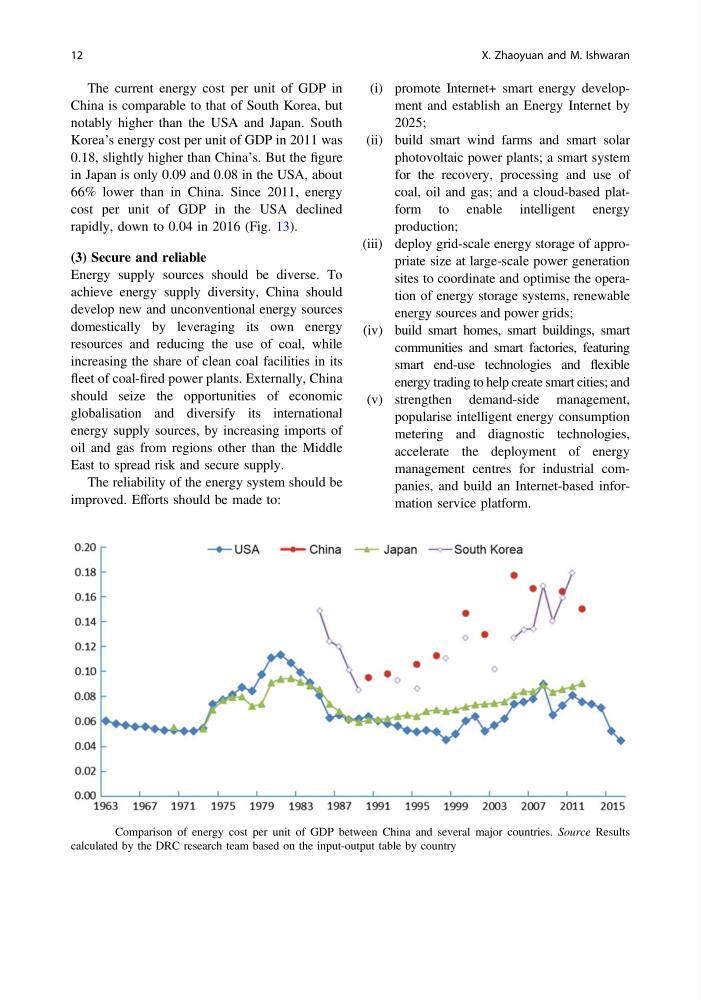
The current energy cost per unit of GDP in
China is comparable to that of South Korea, but
notably higher than the USA and Japan. South
Korea’s energy cost per unit of GDP in 2011 was
0.18, slightly higher than China’s. But the figure
in Japan is only 0.09 and 0.08 in the USA, about
66% lower than in China. Since 2011, energy
cost per unit of GDP in the USA declined
rapidly, down to 0.04 in 2016 (Fig. 13).
(3) Secure and reliable
Energy supply sources should be diverse. To
achieve energy supply diversity, China should
develop new and unconventional energy sources
domestically by leveraging its own energy
resources and reducing the use of coal, while
increasing the share of clean coal facilities in its
fleet of coal-fired power plants. Externally, China
should seize the opportunities of economic
globalisation and diversify its international
energy supply sources, by increasing imports of
oil and gas from regions other than the Middle
East to spread risk and secure supply.
The reliability of the energy system should be
improved. Efforts should be made to:
(i) promote Internet+ smart energy development and establish an Energy Internet by
2025;
(ii) build smart wind farms and smart solar
photovoltaic power plants; a smart system
for the recovery, processing and use of
coal, oil and gas; and a cloud-based platform to enable intelligent energy
production;
(iii) deploy grid-scale energy storage of appropriate size at large-scale power generation
sites to coordinate and optimise the operation of energy storage systems, renewable
energy sources and power grids;
(iv) build smart homes, smart buildings, smart
communities and smart factories, featuring
smart end-use technologies and flexible
energy trading to help create smart cities; and
(v) strengthen demand-side management,
popularise intelligent energy consumption
metering and diagnostic technologies,
accelerate the deployment of energy
management centres for industrial companies, and build an Internet-based information service platform.
Fig. 13 Comparison of energy cost per unit of GDP between China and several major countries. Source Results
calculated by the DRC research team based on the input-output table by country
12
X. Zhaoyuan and M. Ishwaran
China is comparable to that of South Korea, but
notably higher than the USA and Japan. South
Korea’s energy cost per unit of GDP in 2011 was
0.18, slightly higher than China’s. But the figure
in Japan is only 0.09 and 0.08 in the USA, about
66% lower than in China. Since 2011, energy
cost per unit of GDP in the USA declined
rapidly, down to 0.04 in 2016 (Fig. 13).
(3) Secure and reliable
Energy supply sources should be diverse. To
achieve energy supply diversity, China should
develop new and unconventional energy sources
domestically by leveraging its own energy
resources and reducing the use of coal, while
increasing the share of clean coal facilities in its
fleet of coal-fired power plants. Externally, China
should seize the opportunities of economic
globalisation and diversify its international
energy supply sources, by increasing imports of
oil and gas from regions other than the Middle
East to spread risk and secure supply.
The reliability of the energy system should be
improved. Efforts should be made to:
(i) promote Internet+ smart energy development and establish an Energy Internet by
2025;
(ii) build smart wind farms and smart solar
photovoltaic power plants; a smart system
for the recovery, processing and use of
coal, oil and gas; and a cloud-based platform to enable intelligent energy
production;
(iii) deploy grid-scale energy storage of appropriate size at large-scale power generation
sites to coordinate and optimise the operation of energy storage systems, renewable
energy sources and power grids;
(iv) build smart homes, smart buildings, smart
communities and smart factories, featuring
smart end-use technologies and flexible
energy trading to help create smart cities; and
(v) strengthen demand-side management,
popularise intelligent energy consumption
metering and diagnostic technologies,
accelerate the deployment of energy
management centres for industrial companies, and build an Internet-based information service platform.
Fig. 13 Comparison of energy cost per unit of GDP between China and several major countries. Source Results
calculated by the DRC research team based on the input-output table by country
12
X. Zhaoyuan and M. Ishwaran