

2020, China’s CO 2 emissions per unit of GDP
will decrease by 18% compared to 2015, and by
2030 they will drop by 60–65% compared to
2005. The findings of this report show that to
achieve the goal of carbon intensity reduction,
additional policies and measures—including
carbon pricing and subsidies for non-fossil
energy sources—need to be gradually introduced to achieve tangible results.
In terms of the energy mix, the share of clean
energy should increase significantly. According to
the Energy Production and Consumption Revolution Strategy (2016–30), the share of non-fossil
energy in China will be 15% by 2020, increasing
to about 20% by 2030. In the Recommended
scenario of this report, in which the energy revolution is strongly promoted, the share of non-fossil
energy is expected to reach 15.7% by 2020, 22.5%
by 2030, and more than 40% by 2050.
(2) Affordable and efficient
According to the above-mentioned strategy,
energy consumption per unit of GDP is expected
to drop by 15% by 2020 (compared to 2015),
reach the current world average by 2030 (based
on current prices), and achieve stability by 2050.
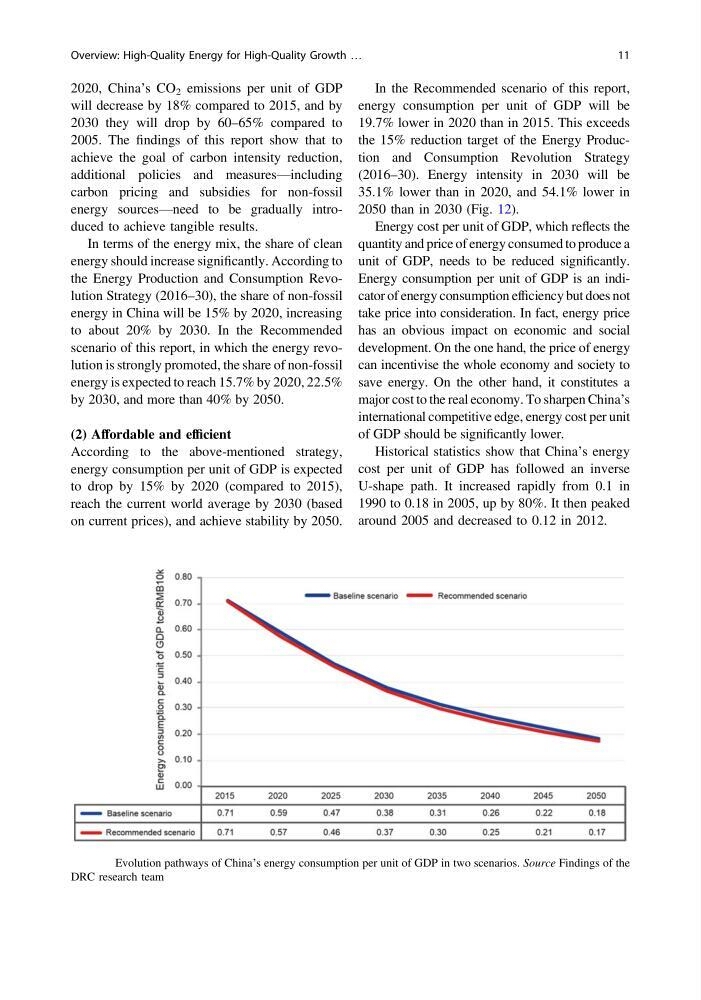
In the Recommended scenario of this report,
energy consumption per unit of GDP will be
19.7% lower in 2020 than in 2015. This exceeds
the 15% reduction target of the Energy Production and Consumption Revolution Strategy
(2016–30). Energy intensity in 2030 will be
35.1% lower than in 2020, and 54.1% lower in
2050 than in 2030 (Fig. 12).
Energy cost per unit of GDP, which reflects the
quantity and price of energy consumed to produce a
unit of GDP, needs to be reduced significantly.
Energy consumption per unit of GDP is an indicator of energy consumption efficiency but does not
take price into consideration. In fact, energy price
has an obvious impact on economic and social
development. On the one hand, the price of energy
can incentivise the whole economy and society to
save energy. On the other hand, it constitutes a
major cost to the real economy. To sharpen China’s
international competitive edge, energy cost per unit
of GDP should be significantly lower.
Historical statistics show that China’s energy
cost per unit of GDP has followed an inverse
U-shape path. It increased rapidly from 0.1 in
1990 to 0.18 in 2005, up by 80%. It then peaked
around 2005 and decreased to 0.12 in 2012.
Fig. 12 Evolution pathways of China’s energy consumption per unit of GDP in two scenarios. Source Findings of the
DRC research team
Overview: High-Quality Energy for High-Quality Growth …
11
will decrease by 18% compared to 2015, and by
2030 they will drop by 60–65% compared to
2005. The findings of this report show that to
achieve the goal of carbon intensity reduction,
additional policies and measures—including
carbon pricing and subsidies for non-fossil
energy sources—need to be gradually introduced to achieve tangible results.
In terms of the energy mix, the share of clean
energy should increase significantly. According to
the Energy Production and Consumption Revolution Strategy (2016–30), the share of non-fossil
energy in China will be 15% by 2020, increasing
to about 20% by 2030. In the Recommended
scenario of this report, in which the energy revolution is strongly promoted, the share of non-fossil
energy is expected to reach 15.7% by 2020, 22.5%
by 2030, and more than 40% by 2050.
(2) Affordable and efficient
According to the above-mentioned strategy,
energy consumption per unit of GDP is expected
to drop by 15% by 2020 (compared to 2015),
reach the current world average by 2030 (based
on current prices), and achieve stability by 2050.
In the Recommended scenario of this report,
energy consumption per unit of GDP will be
19.7% lower in 2020 than in 2015. This exceeds
the 15% reduction target of the Energy Production and Consumption Revolution Strategy
(2016–30). Energy intensity in 2030 will be
35.1% lower than in 2020, and 54.1% lower in
2050 than in 2030 (Fig. 12).
Energy cost per unit of GDP, which reflects the
quantity and price of energy consumed to produce a
unit of GDP, needs to be reduced significantly.
Energy consumption per unit of GDP is an indicator of energy consumption efficiency but does not
take price into consideration. In fact, energy price
has an obvious impact on economic and social
development. On the one hand, the price of energy
can incentivise the whole economy and society to
save energy. On the other hand, it constitutes a
major cost to the real economy. To sharpen China’s
international competitive edge, energy cost per unit
of GDP should be significantly lower.
Historical statistics show that China’s energy
cost per unit of GDP has followed an inverse
U-shape path. It increased rapidly from 0.1 in
1990 to 0.18 in 2005, up by 80%. It then peaked
around 2005 and decreased to 0.12 in 2012.
Fig. 12 Evolution pathways of China’s energy consumption per unit of GDP in two scenarios. Source Findings of the
DRC research team
Overview: High-Quality Energy for High-Quality Growth …
11