

largest coal market, consuming almost half of
global output in 2035. In the same period, India
will register the highest growth in coal demand
(435 Mtoe) and become the world’s second largest coal consumer ahead of the USA. Although
strong growth in coal demand in India and South
East Asia can offset lower demand in the USA
and the EU, it is unlikely that India and South
East Asia will drive the global coal market as
China did previously.
Global demand for hydropower and nuclear
power will grow steadily at an average rate of
1.8% and 1.9% respectively, due mainly to
growing demand for energy in Asia. China’s
unprecedented development of hydropower will
come to an end, settling at an average annual
growth rate of 1.7% in 2014–25. Brazil will have
the second highest growth rate (after China) and
will replace Canada as the world’s largest
hydropower producer. China’s nuclear power
demand will grow rapidly, climbing to an average annual growth rate of 11.2%, which is higher
than China’s growth rate in hydropower over the
past two decades. China’s demand for nuclear
power is forecast to double by 2020 and increase
ninefold over the current level by 2035.
According to the U.S. Energy Information
Administration’s (EIA) World Energy Outlook
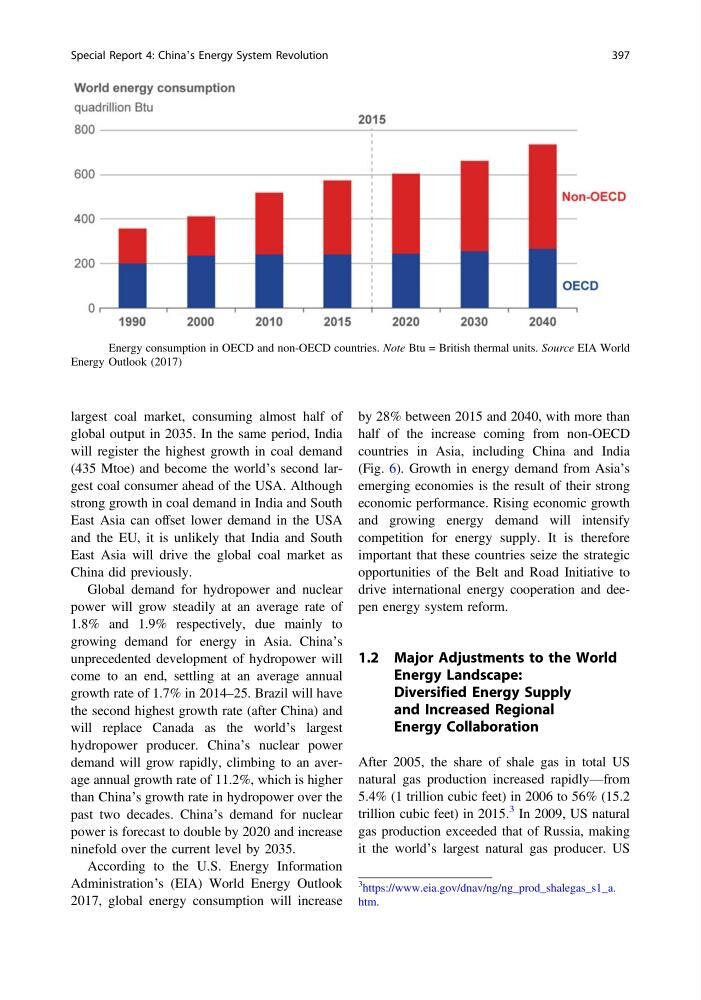
2017, global energy consumption will increase
by 28% between 2015 and 2040, with more than
half of the increase coming from non-OECD
countries in Asia, including China and India
(Fig. 6). Growth in energy demand from Asia’s
emerging economies is the result of their strong
economic performance. Rising economic growth
and growing energy demand will intensify
competition for energy supply. It is therefore
important that these countries seize the strategic
opportunities of the Belt and Road Initiative to
drive international energy cooperation and deepen energy system reform.
1.2 Major Adjustments to the World
Energy Landscape:
Diversified Energy Supply
and Increased Regional
Energy Collaboration
After 2005, the share of shale gas in total US
natural gas production increased rapidly—from
5.4% (1 trillion cubic feet) in 2006 to 56% (15.2
trillion cubic feet) in 2015.
3 In 2009, US natural
gas production exceeded that of Russia, making
it the world’s largest natural gas producer. US
Fig. 6 Energy consumption in OECD and non-OECD countries. Note Btu = British thermal units. Source EIA World
Energy Outlook (2017)
3
https://www.eia.gov/dnav/ng/ng_prod_shalegas_s1_a.
htm.
Special Report 4: China’s Energy System Revolution
397
global output in 2035. In the same period, India
will register the highest growth in coal demand
(435 Mtoe) and become the world’s second largest coal consumer ahead of the USA. Although
strong growth in coal demand in India and South
East Asia can offset lower demand in the USA
and the EU, it is unlikely that India and South
East Asia will drive the global coal market as
China did previously.
Global demand for hydropower and nuclear
power will grow steadily at an average rate of
1.8% and 1.9% respectively, due mainly to
growing demand for energy in Asia. China’s
unprecedented development of hydropower will
come to an end, settling at an average annual
growth rate of 1.7% in 2014–25. Brazil will have
the second highest growth rate (after China) and
will replace Canada as the world’s largest
hydropower producer. China’s nuclear power
demand will grow rapidly, climbing to an average annual growth rate of 11.2%, which is higher
than China’s growth rate in hydropower over the
past two decades. China’s demand for nuclear
power is forecast to double by 2020 and increase
ninefold over the current level by 2035.
According to the U.S. Energy Information
Administration’s (EIA) World Energy Outlook
2017, global energy consumption will increase
by 28% between 2015 and 2040, with more than
half of the increase coming from non-OECD
countries in Asia, including China and India
(Fig. 6). Growth in energy demand from Asia’s
emerging economies is the result of their strong
economic performance. Rising economic growth
and growing energy demand will intensify
competition for energy supply. It is therefore
important that these countries seize the strategic
opportunities of the Belt and Road Initiative to
drive international energy cooperation and deepen energy system reform.
1.2 Major Adjustments to the World
Energy Landscape:
Diversified Energy Supply
and Increased Regional
Energy Collaboration
After 2005, the share of shale gas in total US
natural gas production increased rapidly—from
5.4% (1 trillion cubic feet) in 2006 to 56% (15.2
trillion cubic feet) in 2015.
3 In 2009, US natural
gas production exceeded that of Russia, making
it the world’s largest natural gas producer. US
Fig. 6 Energy consumption in OECD and non-OECD countries. Note Btu = British thermal units. Source EIA World
Energy Outlook (2017)
3
https://www.eia.gov/dnav/ng/ng_prod_shalegas_s1_a.
htm.
Special Report 4: China’s Energy System Revolution
397