

In the BAU scenario, where no additional
policies are introduced, China’s carbon emissions growth will continue to 2040 and decrease
slowly thereafter. In the single carbon pricing
scenario, China’s carbon emissions curve will
gradually decline. When the initial carbon price
level is set at $30/tC, China’s carbon emissions
will peak in 2035, remain stable for five years,
before decreasing after 2040. When the carbon
price level stands at $60/tC, China’s carbon
emissions peak will not arrive significantly earlier, although the emissions path will be adjusted
noticeably compared to the $30/tC scenario.
Cumulative carbon emissions will also decline
significantly by 2030 and 2050. When the carbon
price is increased to $90/tC, China’s carbon
emissions will peak around 2030 and maintain
that level until 2035, and then decrease.
In the combined policy scenario of carbon
pricing and non-fossil energy subsidies, the
evolution of carbon emissions shows a significant difference compared to that of the single
policy scenario. First, in the combined policy
scenario, a lower carbon price level can make an
early carbon emissions peak possible. Specifically, with a carbon price level of $30/tC and a
non-fossil energy price subsidy of 30%, China’s
carbon emissions peak in 2030 and maintain that
level to 2035, before decreasing. Moreover, the
carbon emissions curve in the combined policy
scenario shows little difference to that in the
single carbon pricing policy scenario in the short
term. In the medium and long terms, however, a
gap develops: carbon emissions in the combined
policy scenario are significantly lower than those
in the single carbon pricing policy scenario. This
is due to less renewable energy in the short term
and the path dependence effect (once a path is
entered it is difficult to leave).
Finally, we can conclude from the policy
scenarios the following: Given that China’s carbon policy goal is to reach peak carbon emissions
by 2030 (with no specific peaking level target),
China could have various carbon emission paths
to choose from. Which carbon pathway China is
to pick will to a large extend dictate the policy
pathway in the future.
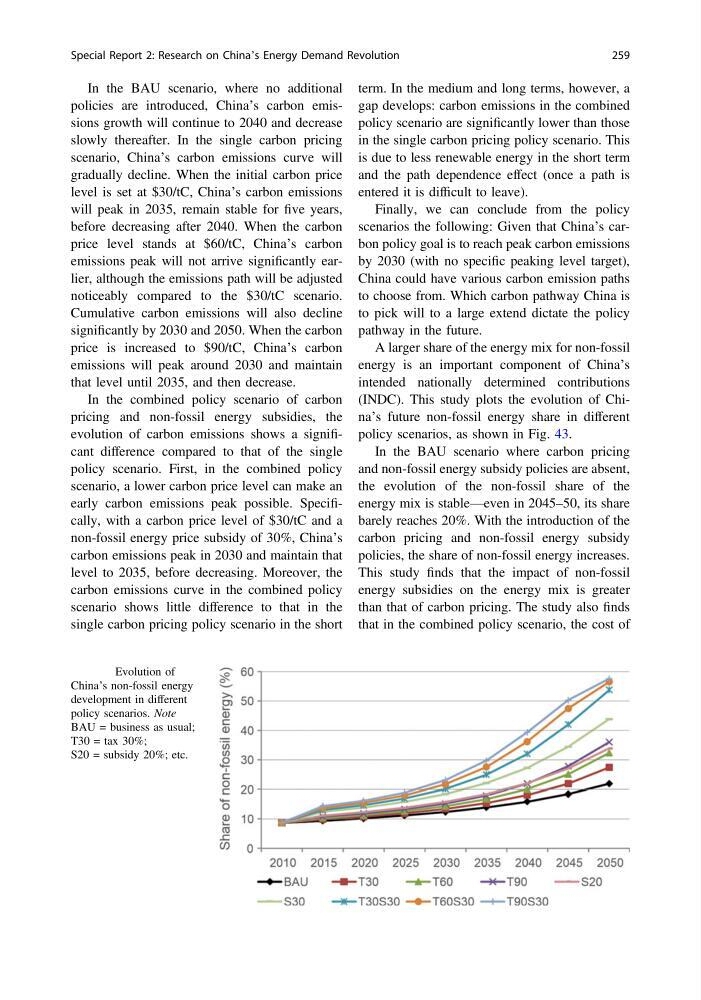
A larger share of the energy mix for non-fossil
energy is an important component of China’s
intended nationally determined contributions
(INDC). This study plots the evolution of China’s future non-fossil energy share in different
policy scenarios, as shown in Fig. 43.
In the BAU scenario where carbon pricing
and non-fossil energy subsidy policies are absent,
the evolution of the non-fossil share of the
energy mix is stable—even in 2045–50, its share
barely reaches 20%. With the introduction of the
carbon pricing and non-fossil energy subsidy
policies, the share of non-fossil energy increases.
This study finds that the impact of non-fossil
energy subsidies on the energy mix is greater
than that of carbon pricing. The study also finds
that in the combined policy scenario, the cost of
Fig. 43 Evolution of
China’s non-fossil energy
development in different
policy scenarios. Note
BAU = business as usual;
T30 = tax 30%;
S20 = subsidy 20%; etc.
Special Report 2: Research on China’s Energy Demand Revolution
259
policies are introduced, China’s carbon emissions growth will continue to 2040 and decrease
slowly thereafter. In the single carbon pricing
scenario, China’s carbon emissions curve will
gradually decline. When the initial carbon price
level is set at $30/tC, China’s carbon emissions
will peak in 2035, remain stable for five years,
before decreasing after 2040. When the carbon
price level stands at $60/tC, China’s carbon
emissions peak will not arrive significantly earlier, although the emissions path will be adjusted
noticeably compared to the $30/tC scenario.
Cumulative carbon emissions will also decline
significantly by 2030 and 2050. When the carbon
price is increased to $90/tC, China’s carbon
emissions will peak around 2030 and maintain
that level until 2035, and then decrease.
In the combined policy scenario of carbon
pricing and non-fossil energy subsidies, the
evolution of carbon emissions shows a significant difference compared to that of the single
policy scenario. First, in the combined policy
scenario, a lower carbon price level can make an
early carbon emissions peak possible. Specifically, with a carbon price level of $30/tC and a
non-fossil energy price subsidy of 30%, China’s
carbon emissions peak in 2030 and maintain that
level to 2035, before decreasing. Moreover, the
carbon emissions curve in the combined policy
scenario shows little difference to that in the
single carbon pricing policy scenario in the short
term. In the medium and long terms, however, a
gap develops: carbon emissions in the combined
policy scenario are significantly lower than those
in the single carbon pricing policy scenario. This
is due to less renewable energy in the short term
and the path dependence effect (once a path is
entered it is difficult to leave).
Finally, we can conclude from the policy
scenarios the following: Given that China’s carbon policy goal is to reach peak carbon emissions
by 2030 (with no specific peaking level target),
China could have various carbon emission paths
to choose from. Which carbon pathway China is
to pick will to a large extend dictate the policy
pathway in the future.
A larger share of the energy mix for non-fossil
energy is an important component of China’s
intended nationally determined contributions
(INDC). This study plots the evolution of China’s future non-fossil energy share in different
policy scenarios, as shown in Fig. 43.
In the BAU scenario where carbon pricing
and non-fossil energy subsidy policies are absent,
the evolution of the non-fossil share of the
energy mix is stable—even in 2045–50, its share
barely reaches 20%. With the introduction of the
carbon pricing and non-fossil energy subsidy
policies, the share of non-fossil energy increases.
This study finds that the impact of non-fossil
energy subsidies on the energy mix is greater
than that of carbon pricing. The study also finds
that in the combined policy scenario, the cost of
Fig. 43 Evolution of
China’s non-fossil energy
development in different
policy scenarios. Note
BAU = business as usual;
T30 = tax 30%;
S20 = subsidy 20%; etc.
Special Report 2: Research on China’s Energy Demand Revolution
259