

energy intensity in 2030 will be 46.8% lower
than in 2010. This is due mainly to the
improvement in energy efficiency caused by
non-price factors, such as economic restructuring
and technology advances.
3.4.2 The Effects of Non-fossil Energy
Technology on Energy
Demand
In addition to fossil energy prices, technology
advances and the cost of non-fossil energy can
impact future energy demand significantly. The
cost reduction potential of new and renewable
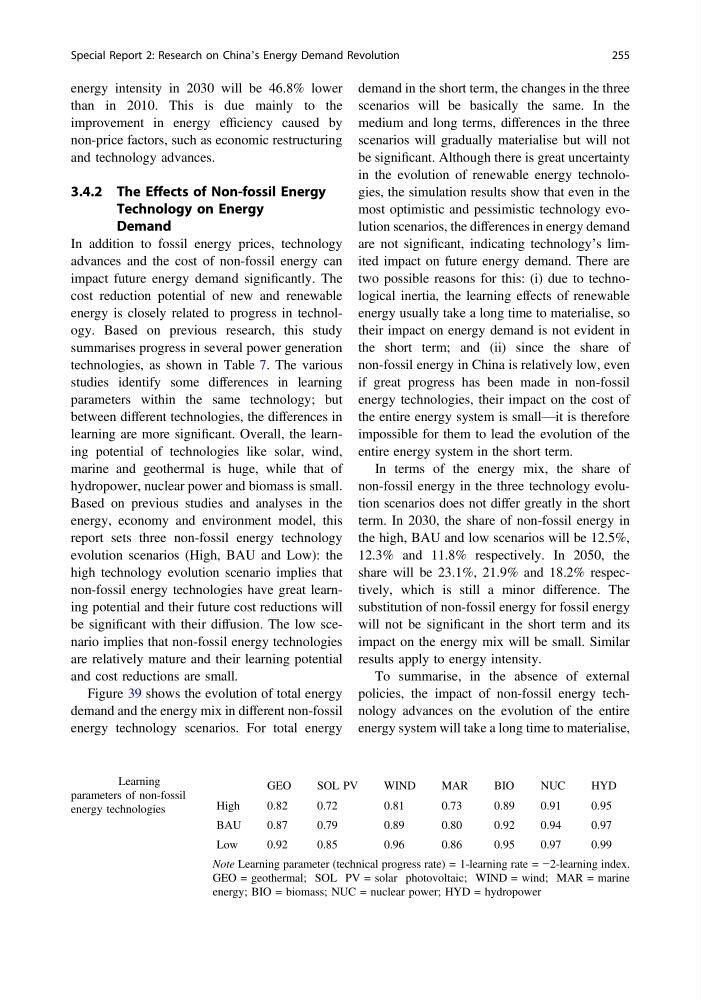
energy is closely related to progress in technology. Based on previous research, this study
summarises progress in several power generation
technologies, as shown in Table 7. The various
studies identify some differences in learning
parameters within the same technology; but
between different technologies, the differences in
learning are more significant. Overall, the learning potential of technologies like solar, wind,
marine and geothermal is huge, while that of
hydropower, nuclear power and biomass is small.
Based on previous studies and analyses in the
energy, economy and environment model, this
report sets three non-fossil energy technology
evolution scenarios (High, BAU and Low): the
high technology evolution scenario implies that
non-fossil energy technologies have great learning potential and their future cost reductions will
be significant with their diffusion. The low scenario implies that non-fossil energy technologies
are relatively mature and their learning potential
and cost reductions are small.
Figure 39 shows the evolution of total energy
demand and the energy mix in different non-fossil
energy technology scenarios. For total energy
demand in the short term, the changes in the three
scenarios will be basically the same. In the
medium and long terms, differences in the three
scenarios will gradually materialise but will not
be significant. Although there is great uncertainty
in the evolution of renewable energy technologies, the simulation results show that even in the
most optimistic and pessimistic technology evolution scenarios, the differences in energy demand
are not significant, indicating technology’s limited impact on future energy demand. There are
two possible reasons for this: (i) due to technological inertia, the learning effects of renewable
energy usually take a long time to materialise, so
their impact on energy demand is not evident in
the short term; and (ii) since the share of
non-fossil energy in China is relatively low, even
if great progress has been made in non-fossil
energy technologies, their impact on the cost of
the entire energy system is small—it is therefore
impossible for them to lead the evolution of the
entire energy system in the short term.
In terms of the energy mix, the share of
non-fossil energy in the three technology evolution scenarios does not differ greatly in the short
term. In 2030, the share of non-fossil energy in
the high, BAU and low scenarios will be 12.5%,
12.3% and 11.8% respectively. In 2050, the
share will be 23.1%, 21.9% and 18.2% respectively, which is still a minor difference. The
substitution of non-fossil energy for fossil energy
will not be significant in the short term and its
impact on the energy mix will be small. Similar
results apply to energy intensity.
To summarise, in the absence of external
policies, the impact of non-fossil energy technology advances on the evolution of the entire
energy system will take a long time to materialise,
Table 7 Learning
parameters of non-fossil
energy technologies
GEO
SOL PV
WIND
MAR
BIO
NUC
HYD
High
0.82
0.72
0.81
0.73
0.89
0.91
0.95
BAU
0.87
0.79
0.89
0.80
0.92
0.94
0.97
Low
0.92
0.85
0.96
0.86
0.95
0.97
0.99
Note Learning parameter (technical progress rate) = 1-learning rate = −2-learning index.
GEO = geothermal; SOL PV = solar photovoltaic; WIND = wind; MAR = marine
energy; BIO = biomass; NUC = nuclear power; HYD = hydropower
Special Report 2: Research on China’s Energy Demand Revolution
255
than in 2010. This is due mainly to the
improvement in energy efficiency caused by
non-price factors, such as economic restructuring
and technology advances.
3.4.2 The Effects of Non-fossil Energy
Technology on Energy
Demand
In addition to fossil energy prices, technology
advances and the cost of non-fossil energy can
impact future energy demand significantly. The
cost reduction potential of new and renewable
energy is closely related to progress in technology. Based on previous research, this study
summarises progress in several power generation
technologies, as shown in Table 7. The various
studies identify some differences in learning
parameters within the same technology; but
between different technologies, the differences in
learning are more significant. Overall, the learning potential of technologies like solar, wind,
marine and geothermal is huge, while that of
hydropower, nuclear power and biomass is small.
Based on previous studies and analyses in the
energy, economy and environment model, this
report sets three non-fossil energy technology
evolution scenarios (High, BAU and Low): the
high technology evolution scenario implies that
non-fossil energy technologies have great learning potential and their future cost reductions will
be significant with their diffusion. The low scenario implies that non-fossil energy technologies
are relatively mature and their learning potential
and cost reductions are small.
Figure 39 shows the evolution of total energy
demand and the energy mix in different non-fossil
energy technology scenarios. For total energy
demand in the short term, the changes in the three
scenarios will be basically the same. In the
medium and long terms, differences in the three
scenarios will gradually materialise but will not
be significant. Although there is great uncertainty
in the evolution of renewable energy technologies, the simulation results show that even in the
most optimistic and pessimistic technology evolution scenarios, the differences in energy demand
are not significant, indicating technology’s limited impact on future energy demand. There are
two possible reasons for this: (i) due to technological inertia, the learning effects of renewable
energy usually take a long time to materialise, so
their impact on energy demand is not evident in
the short term; and (ii) since the share of
non-fossil energy in China is relatively low, even
if great progress has been made in non-fossil
energy technologies, their impact on the cost of
the entire energy system is small—it is therefore
impossible for them to lead the evolution of the
entire energy system in the short term.
In terms of the energy mix, the share of
non-fossil energy in the three technology evolution scenarios does not differ greatly in the short
term. In 2030, the share of non-fossil energy in
the high, BAU and low scenarios will be 12.5%,
12.3% and 11.8% respectively. In 2050, the
share will be 23.1%, 21.9% and 18.2% respectively, which is still a minor difference. The
substitution of non-fossil energy for fossil energy
will not be significant in the short term and its
impact on the energy mix will be small. Similar
results apply to energy intensity.
To summarise, in the absence of external
policies, the impact of non-fossil energy technology advances on the evolution of the entire
energy system will take a long time to materialise,
Table 7 Learning
parameters of non-fossil
energy technologies
GEO
SOL PV
WIND
MAR
BIO
NUC
HYD
High
0.82
0.72
0.81
0.73
0.89
0.91
0.95
BAU
0.87
0.79
0.89
0.80
0.92
0.94
0.97
Low
0.92
0.85
0.96
0.86
0.95
0.97
0.99
Note Learning parameter (technical progress rate) = 1-learning rate = −2-learning index.
GEO = geothermal; SOL PV = solar photovoltaic; WIND = wind; MAR = marine
energy; BIO = biomass; NUC = nuclear power; HYD = hydropower
Special Report 2: Research on China’s Energy Demand Revolution
255