

of energy sources and the evolution of the energy
demand structure in the medium and long terms.
Technology evolution and the cost reduction
potential of a mature energy like conventional
fossil fuels are relatively limited. Whereas new
energy like renewables, especially wind and
solar, which are in the early stages of development compared to fossil energy, still have great
potential for technology evolution. The rapid
development of renewable energy over the past
decade has made cost reductions possible, which
is evident in China and all over the world. In
Fig. 34, the evolution of wind and solar PV
generation shows that although costs differ across
the world, this is due mainly to differences in
investment costs, resource conditions and other
factors. The average cost of onshore wind power
generation decreased from $0.2/kWh in 1995 to
$0.10/kWh in 2005 and $0.07/kWh in 2015, with
an average cost reduction of about 65% over the
20-year period. The cost of utility-scale solar PV
generation dropped more significantly, from
$0.31/kWh in 2010 to $0.13/kWh in 2015,
giving an average cost reduction of 58% over the
five years.
The technological advances and cost reductions achieved in renewable energy over the past
decade are mostly due to significantly lower
investment costs, made possible by the learning
effects of growing installed capacity. Future
reductions in the cost of renewable energy generation will come from lower equipment and
component costs, improvements in operating
efficiency, and lower operations and maintenance
costs. According to the International Renewable
Energy Agency (IRENA), the potential for future
reductions in renewable energy costs will remain
significant, with a projected 26 and 35% reduction in onshore and offshore wind power levelised cost of energy (LCOE) by 2025. The
reductions in solar power will be even greater:
the LCOE of solar photovoltaic and solar thermal
will fall by 43% and 59% respectively. Other
new and renewable types of energy, including
nuclear, biomass, geothermal, hydro and marine
energy, also have potential for cost reductions.
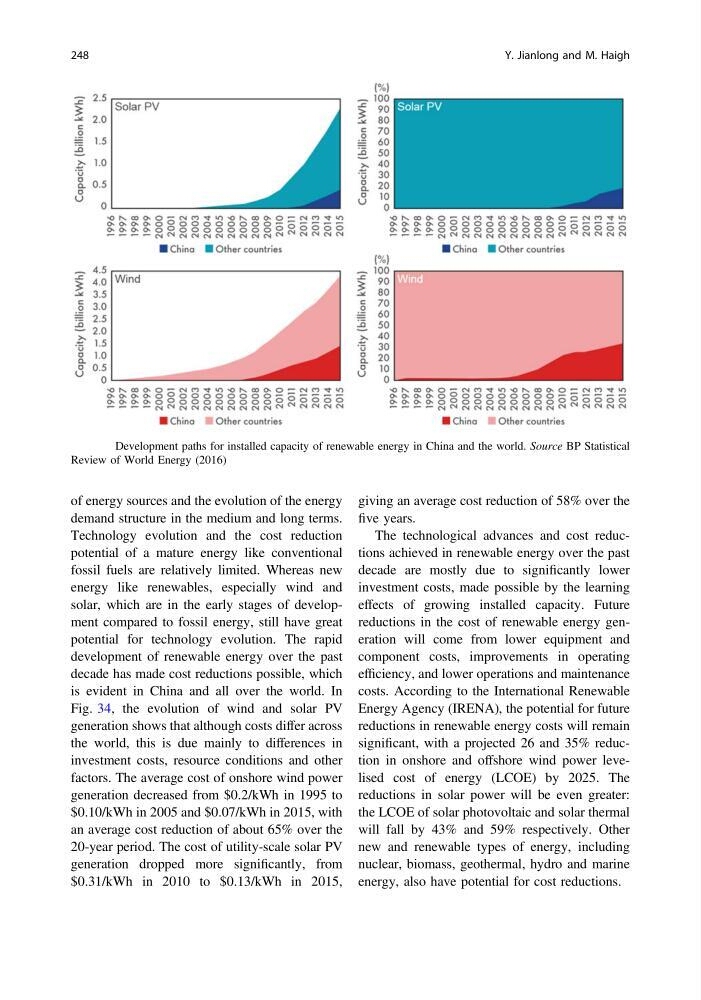
Fig. 33 Development paths for installed capacity of renewable energy in China and the world. Source BP Statistical
Review of World Energy (2016)
248
Y. Jianlong and M. Haigh
demand structure in the medium and long terms.
Technology evolution and the cost reduction
potential of a mature energy like conventional
fossil fuels are relatively limited. Whereas new
energy like renewables, especially wind and
solar, which are in the early stages of development compared to fossil energy, still have great
potential for technology evolution. The rapid
development of renewable energy over the past
decade has made cost reductions possible, which
is evident in China and all over the world. In
Fig. 34, the evolution of wind and solar PV
generation shows that although costs differ across
the world, this is due mainly to differences in
investment costs, resource conditions and other
factors. The average cost of onshore wind power
generation decreased from $0.2/kWh in 1995 to
$0.10/kWh in 2005 and $0.07/kWh in 2015, with
an average cost reduction of about 65% over the
20-year period. The cost of utility-scale solar PV
generation dropped more significantly, from
$0.31/kWh in 2010 to $0.13/kWh in 2015,
giving an average cost reduction of 58% over the
five years.
The technological advances and cost reductions achieved in renewable energy over the past
decade are mostly due to significantly lower
investment costs, made possible by the learning
effects of growing installed capacity. Future
reductions in the cost of renewable energy generation will come from lower equipment and
component costs, improvements in operating
efficiency, and lower operations and maintenance
costs. According to the International Renewable
Energy Agency (IRENA), the potential for future
reductions in renewable energy costs will remain
significant, with a projected 26 and 35% reduction in onshore and offshore wind power levelised cost of energy (LCOE) by 2025. The
reductions in solar power will be even greater:
the LCOE of solar photovoltaic and solar thermal
will fall by 43% and 59% respectively. Other
new and renewable types of energy, including
nuclear, biomass, geothermal, hydro and marine
energy, also have potential for cost reductions.
Fig. 33 Development paths for installed capacity of renewable energy in China and the world. Source BP Statistical
Review of World Energy (2016)
248
Y. Jianlong and M. Haigh