

3 The Effects of the Energy Pricing
Mechanism on China’s Mediumand Long-Term Energy Demand
3.1 The Evolution of Fossil Energy
Prices in the Medium
and Long Terms
3.1.1 Coal Market
As the most important primary energy source in
China, coal plays a dominant role in the entire
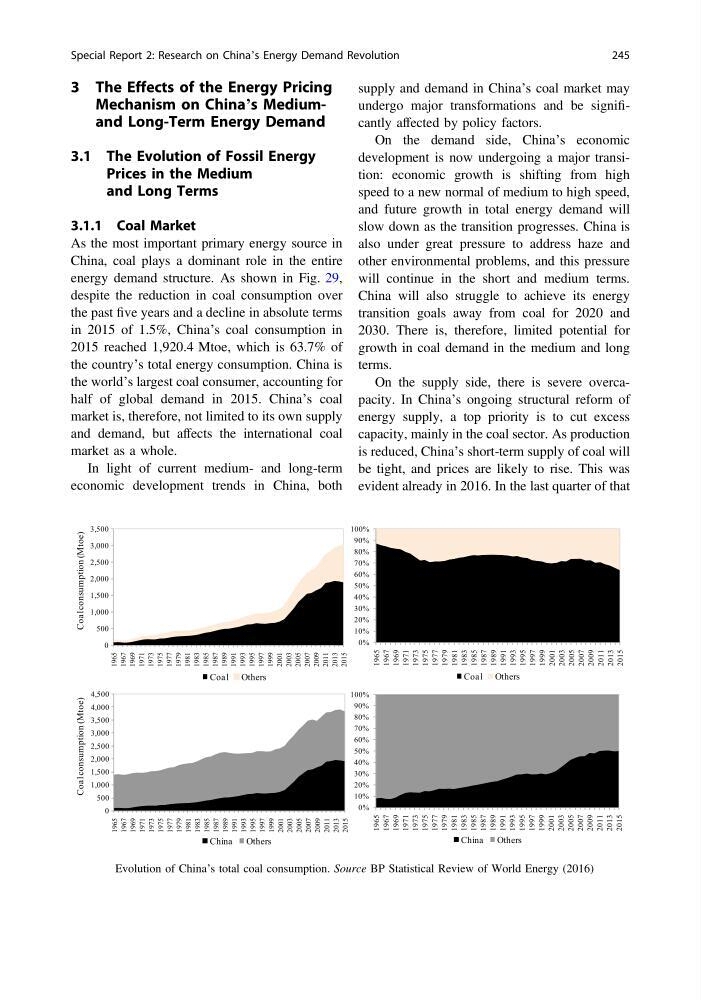
energy demand structure. As shown in Fig. 29,
despite the reduction in coal consumption over
the past five years and a decline in absolute terms
in 2015 of 1.5%, China’s coal consumption in
2015 reached 1,920.4 Mtoe, which is 63.7% of
the country’s total energy consumption. China is
the world’s largest coal consumer, accounting for
half of global demand in 2015. China’s coal
market is, therefore, not limited to its own supply
and demand, but affects the international coal
market as a whole.
In light of current medium- and long-term
economic development trends in China, both
supply and demand in China’s coal market may
undergo major transformations and be significantly affected by policy factors.
On the demand side, China’s economic
development is now undergoing a major transition: economic growth is shifting from high
speed to a new normal of medium to high speed,
and future growth in total energy demand will
slow down as the transition progresses. China is
also under great pressure to address haze and
other environmental problems, and this pressure
will continue in the short and medium terms.
China will also struggle to achieve its energy
transition goals away from coal for 2020 and
2030. There is, therefore, limited potential for
growth in coal demand in the medium and long
terms.
On the supply side, there is severe overcapacity. In China’s ongoing structural reform of
energy supply, a top priority is to cut excess
capacity, mainly in the coal sector. As production
is reduced, China’s short-term supply of coal will
be tight, and prices are likely to rise. This was
evident already in 2016. In the last quarter of that
0
500
1,000
1,500
2,000
2,500
3,000
3,500
1965
1967
1969
1971
1973
1975
1977
1979
1981
1983
1985
1987
1989
1991
1993
1995
1997
1999
2001
2003
2005
2007
2009
2011
2013
2015
Coal consumption (Mtoe)
Coal Others
0%
10%
20%
30%
40%
50%
60%
70%
80%
90%
100%
1965
1967
1969
1971
1973
1975
1977
1979
1981
1983
1985
1987
1989
1991
1993
1995
1997
1999
2001
2003
2005
2007
2009
2011
2013
2015
Coal Others
0
500
1,000
1,500
2,000
2,500
3,000
3,500
4,000
4,500
1965
1967
1969
1971
1973
1975
1977
1979
1981
1983
1985
1987
1989
1991
1993
1995
1997
1999
2001
2003
2005
2007
2009
2011
2013
2015
Coal consumption (Mtoe)
China
Others
0%
10%
20%
30%
40%
50%
60%
70%
80%
90%
100%
1965
1967
1969
1971
1973
1975
1977
1979
1981
1983
1985
1987
1989
1991
1993
1995
1997
1999
2001
2003
2005
2007
2009
2011
2013
2015
China
Others
Fig. 29 Evolution of China’s total coal consumption. Source BP Statistical Review of World Energy (2016)
Special Report 2: Research on China’s Energy Demand Revolution
245
Mechanism on China’s Mediumand Long-Term Energy Demand
3.1 The Evolution of Fossil Energy
Prices in the Medium
and Long Terms
3.1.1 Coal Market
As the most important primary energy source in
China, coal plays a dominant role in the entire
energy demand structure. As shown in Fig. 29,
despite the reduction in coal consumption over
the past five years and a decline in absolute terms
in 2015 of 1.5%, China’s coal consumption in
2015 reached 1,920.4 Mtoe, which is 63.7% of
the country’s total energy consumption. China is
the world’s largest coal consumer, accounting for
half of global demand in 2015. China’s coal
market is, therefore, not limited to its own supply
and demand, but affects the international coal
market as a whole.
In light of current medium- and long-term
economic development trends in China, both
supply and demand in China’s coal market may
undergo major transformations and be significantly affected by policy factors.
On the demand side, China’s economic
development is now undergoing a major transition: economic growth is shifting from high
speed to a new normal of medium to high speed,
and future growth in total energy demand will
slow down as the transition progresses. China is
also under great pressure to address haze and
other environmental problems, and this pressure
will continue in the short and medium terms.
China will also struggle to achieve its energy
transition goals away from coal for 2020 and
2030. There is, therefore, limited potential for
growth in coal demand in the medium and long
terms.
On the supply side, there is severe overcapacity. In China’s ongoing structural reform of
energy supply, a top priority is to cut excess
capacity, mainly in the coal sector. As production
is reduced, China’s short-term supply of coal will
be tight, and prices are likely to rise. This was
evident already in 2016. In the last quarter of that
0
500
1,000
1,500
2,000
2,500
3,000
3,500
1965
1967
1969
1971
1973
1975
1977
1979
1981
1983
1985
1987
1989
1991
1993
1995
1997
1999
2001
2003
2005
2007
2009
2011
2013
2015
Coal consumption (Mtoe)
Coal Others
0%
10%
20%
30%
40%
50%
60%
70%
80%
90%
100%
1965
1967
1969
1971
1973
1975
1977
1979
1981
1983
1985
1987
1989
1991
1993
1995
1997
1999
2001
2003
2005
2007
2009
2011
2013
2015
Coal Others
0
500
1,000
1,500
2,000
2,500
3,000
3,500
4,000
4,500
1965
1967
1969
1971
1973
1975
1977
1979
1981
1983
1985
1987
1989
1991
1993
1995
1997
1999
2001
2003
2005
2007
2009
2011
2013
2015
Coal consumption (Mtoe)
China
Others
0%
10%
20%
30%
40%
50%
60%
70%
80%
90%
100%
1965
1967
1969
1971
1973
1975
1977
1979
1981
1983
1985
1987
1989
1991
1993
1995
1997
1999
2001
2003
2005
2007
2009
2011
2013
2015
China
Others
Fig. 29 Evolution of China’s total coal consumption. Source BP Statistical Review of World Energy (2016)
Special Report 2: Research on China’s Energy Demand Revolution
245