

instance, by 2050, the share of non-hydro
renewable energy in TPED will be 15.2%, and
the share of non-hydro and non-nuclear renewable energy in TPED will be even lower at 9.4%.
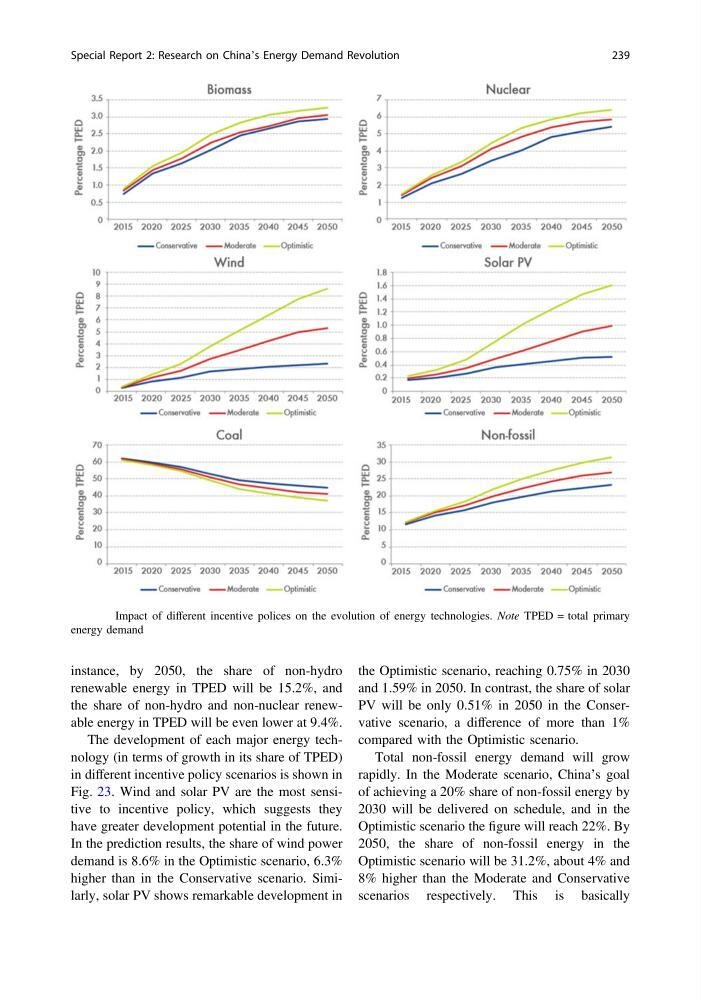
The development of each major energy technology (in terms of growth in its share of TPED)
in different incentive policy scenarios is shown in
Fig. 23. Wind and solar PV are the most sensitive to incentive policy, which suggests they
have greater development potential in the future.
In the prediction results, the share of wind power
demand is 8.6% in the Optimistic scenario, 6.3%
higher than in the Conservative scenario. Similarly, solar PV shows remarkable development in
the Optimistic scenario, reaching 0.75% in 2030
and 1.59% in 2050. In contrast, the share of solar
PV will be only 0.51% in 2050 in the Conservative scenario, a difference of more than 1%
compared with the Optimistic scenario.
Total non-fossil energy demand will grow
rapidly. In the Moderate scenario, China’s goal
of achieving a 20% share of non-fossil energy by
2030 will be delivered on schedule, and in the
Optimistic scenario the figure will reach 22%. By
2050, the share of non-fossil energy in the
Optimistic scenario will be 31.2%, about 4% and
8% higher than the Moderate and Conservative
scenarios respectively. This is basically
Fig. 23 Impact of different incentive polices on the evolution of energy technologies. Note TPED = total primary
energy demand
Special Report 2: Research on China’s Energy Demand Revolution
239
renewable energy in TPED will be 15.2%, and
the share of non-hydro and non-nuclear renewable energy in TPED will be even lower at 9.4%.
The development of each major energy technology (in terms of growth in its share of TPED)
in different incentive policy scenarios is shown in
Fig. 23. Wind and solar PV are the most sensitive to incentive policy, which suggests they
have greater development potential in the future.
In the prediction results, the share of wind power
demand is 8.6% in the Optimistic scenario, 6.3%
higher than in the Conservative scenario. Similarly, solar PV shows remarkable development in
the Optimistic scenario, reaching 0.75% in 2030
and 1.59% in 2050. In contrast, the share of solar
PV will be only 0.51% in 2050 in the Conservative scenario, a difference of more than 1%
compared with the Optimistic scenario.
Total non-fossil energy demand will grow
rapidly. In the Moderate scenario, China’s goal
of achieving a 20% share of non-fossil energy by
2030 will be delivered on schedule, and in the
Optimistic scenario the figure will reach 22%. By
2050, the share of non-fossil energy in the
Optimistic scenario will be 31.2%, about 4% and
8% higher than the Moderate and Conservative
scenarios respectively. This is basically
Fig. 23 Impact of different incentive polices on the evolution of energy technologies. Note TPED = total primary
energy demand
Special Report 2: Research on China’s Energy Demand Revolution
239