

their more recent research. In general, new
technologies have greater potential to drive
technological progress, and thus have a higher
learning rate of 12.9–18.7%. The relatively
mature technologies have a slightly lower learning rate of 9.8–12.9%. The basically proven
technologies have relatively small potential for
technological progress and accordingly have a
lower learning rate of about 7%.
2.3 Baseline Results
From the simulation results, China’s economy
will continue to grow in the future despite its
slowing growth rate. Specifically, China’s economic aggregate will increase from $8.7 trillion
in 2015 to $20.5 trillion in 2030 and about $43
trillion by 2050 (Fig. 18). However, it will be
difficult for China to maintain its current growth
Table 2 Initial share of technology, energy cost, rate of technical substitution and learning rate
Share of energy
technology (%)
Initial cost
RMB/tce
Technical substitution
capability coefficient
Rate of new energy
technology progress (%)
Coal
66.32
2,034.17
–
–
Oil
19.1
3,336.05
9.5
–
Natural gas
5.9
1,505.29
9.0
–
Hydropower
7.10
1,627.34
7.5
0.970
Nuclear
power
0.73
4,068.35
9.0
0.940
Wind power
0.19
4,475.18
6.3
0.885
Solar PV
2.73 E−4
16,273.39
5.5
0.785
Biomass
0.57
8,136.70
4.3
0.920
Marine
energy
2.60 E−5
9,764.04
4.0
0.795
Geothermal
energy
0.0797
8,950.37
4.0
0.870
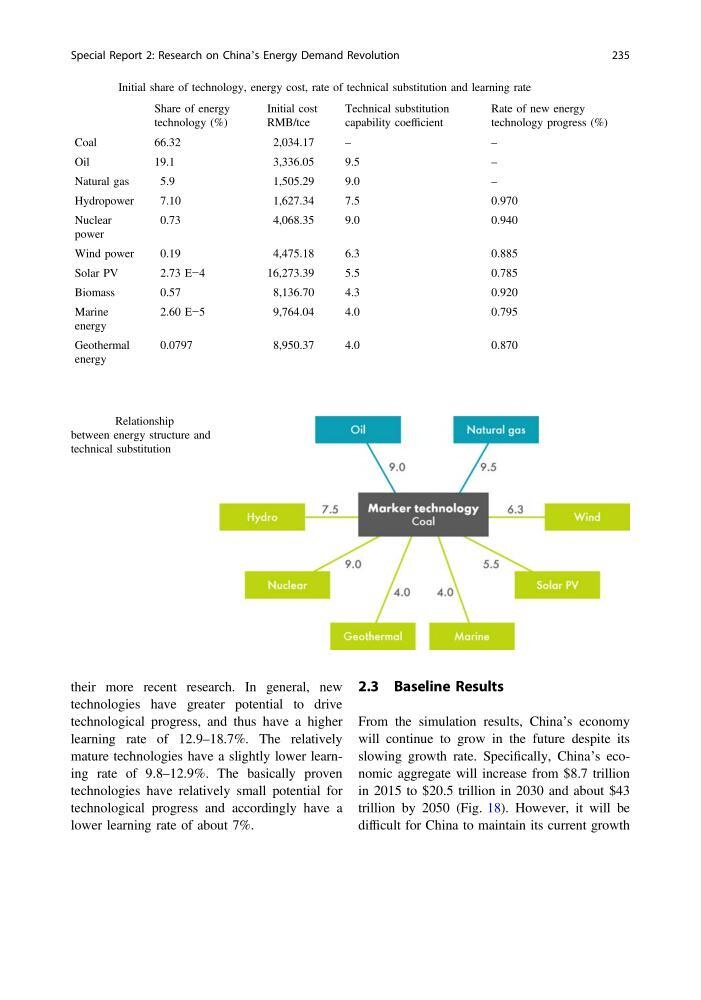
Fig. 17 Relationship
between energy structure and
technical substitution
Special Report 2: Research on China’s Energy Demand Revolution
235
technologies have greater potential to drive
technological progress, and thus have a higher
learning rate of 12.9–18.7%. The relatively
mature technologies have a slightly lower learning rate of 9.8–12.9%. The basically proven
technologies have relatively small potential for
technological progress and accordingly have a
lower learning rate of about 7%.
2.3 Baseline Results
From the simulation results, China’s economy
will continue to grow in the future despite its
slowing growth rate. Specifically, China’s economic aggregate will increase from $8.7 trillion
in 2015 to $20.5 trillion in 2030 and about $43
trillion by 2050 (Fig. 18). However, it will be
difficult for China to maintain its current growth
Table 2 Initial share of technology, energy cost, rate of technical substitution and learning rate
Share of energy
technology (%)
Initial cost
RMB/tce
Technical substitution
capability coefficient
Rate of new energy
technology progress (%)
Coal
66.32
2,034.17
–
–
Oil
19.1
3,336.05
9.5
–
Natural gas
5.9
1,505.29
9.0
–
Hydropower
7.10
1,627.34
7.5
0.970
Nuclear
power
0.73
4,068.35
9.0
0.940
Wind power
0.19
4,475.18
6.3
0.885
Solar PV
2.73 E−4
16,273.39
5.5
0.785
Biomass
0.57
8,136.70
4.3
0.920
Marine
energy
2.60 E−5
9,764.04
4.0
0.795
Geothermal
energy
0.0797
8,950.37
4.0
0.870
Fig. 17 Relationship
between energy structure and
technical substitution
Special Report 2: Research on China’s Energy Demand Revolution
235