

The substitution parameters and technical
learning rate in the logistic model of policy are
provided in Table 2. The substitution parameter
in this model refers to the key parameters that
affect substitution between energy sources. For
the substitution parameter value, this study refers
mainly to the research by Anderson et al.
(2003) which discusses the non-linear behaviour
of this model, and the relationship between the
substitution parameter and the variance of relative price distribution, as well as the basis for the
reference value. The substitution relationship
between energy structure and technology is
shown in Fig. 17. Learning rate is an important
parameter representing new energy technology
progress and cost evolution. McDonald and
Schrattenholzer
4 made initial estimates of the
technological progress rate of various energy
technologies. Later, Kumbaroglu et al., Rout
et al. and Rubin et al.
5 reviewed the estimates in
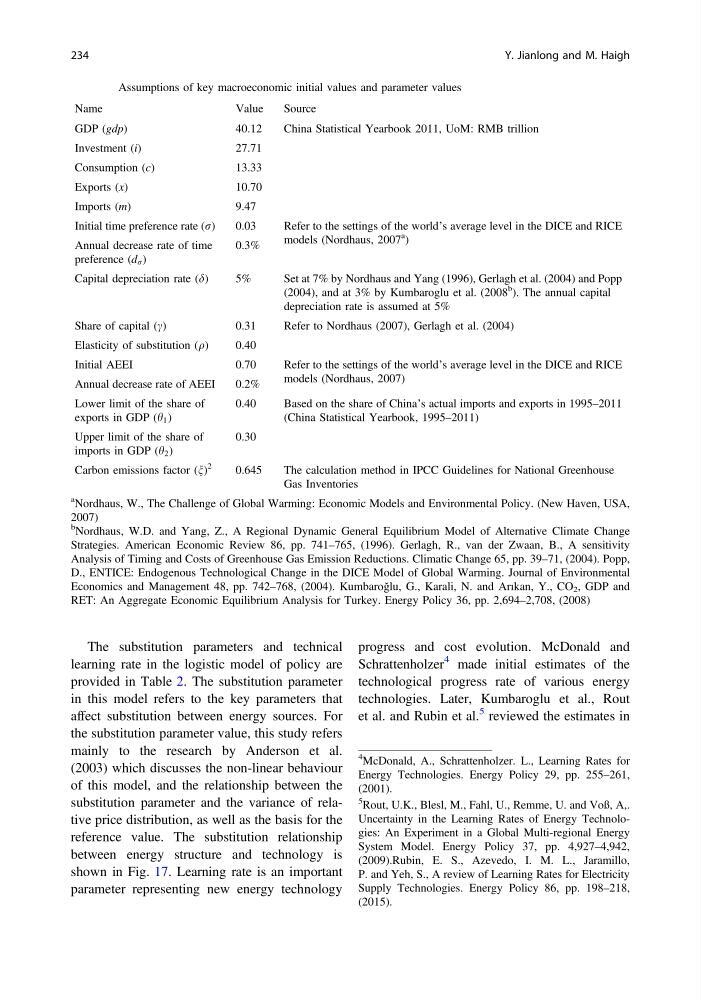
Table 1 Assumptions of key macroeconomic initial values and parameter values
Name
Value
Source
GDP (gdp)
40.12
China Statistical Yearbook 2011, UoM: RMB trillion
Investment (i)
27.71
Consumption (c)
13.33
Exports (x)
10.70
Imports (m)
9.47
Initial time preference rate (r)
0.03
Refer to the settings of the world’s average level in the DICE and RICE
models (Nordhaus, 2007
a )
Annual decrease rate of time
preference (d r )
0.3%
Capital depreciation rate (d)
5%
Set at 7% by Nordhaus and Yang (1996), Gerlagh et al. (2004) and Popp
(2004), and at 3% by Kumbaroglu et al. (2008
b
). The annual capital
depreciation rate is assumed at 5%
Share of capital (c)
0.31
Refer to Nordhaus (2007), Gerlagh et al. (2004)
Elasticity of substitution (q)
0.40
Initial AEEI
0.70
Refer to the settings of the world’s average level in the DICE and RICE
models (Nordhaus, 2007)
Annual decrease rate of AEEI
0.2%
Lower limit of the share of
exports in GDP (h 1 )
0.40
Based on the share of China’s actual imports and exports in 1995–2011
(China Statistical Yearbook, 1995–2011)
Upper limit of the share of
imports in GDP (h 2 )
0.30
Carbon emissions factor (n)
2
0.645
The calculation method in IPCC Guidelines for National Greenhouse
Gas Inventories
a Nordhaus, W., The Challenge of Global Warming: Economic Models and Environmental Policy. (New Haven, USA,
2007)
b
Nordhaus, W.D. and Yang, Z., A Regional Dynamic General Equilibrium Model of Alternative Climate Change
Strategies. American Economic Review 86, pp. 741–765, (1996). Gerlagh, R., van der Zwaan, B., A sensitivity
Analysis of Timing and Costs of Greenhouse Gas Emission Reductions. Climatic Change 65, pp. 39–71, (2004). Popp,
D., ENTICE: Endogenous Technological Change in the DICE Model of Global Warming. Journal of Environmental
Economics and Management 48, pp. 742–768, (2004). Kumbaroğlu, G., Karali, N. and Arıkan, Y., CO 2 , GDP and
RET: An Aggregate Economic Equilibrium Analysis for Turkey. Energy Policy 36, pp. 2,694–2,708, (2008)
4
McDonald, A., Schrattenholzer. L., Learning Rates for
Energy Technologies. Energy Policy 29, pp. 255–261,
(2001).
5
Rout, U.K., Blesl, M., Fahl, U., Remme, U. and Voß, A,.
Uncertainty in the Learning Rates of Energy Technologies: An Experiment in a Global Multi-regional Energy
System Model. Energy Policy 37, pp. 4,927–4,942,
(2009).Rubin, E. S., Azevedo, I. M. L., Jaramillo,
P. and Yeh, S., A review of Learning Rates for Electricity
Supply Technologies. Energy Policy 86, pp. 198–218,
(2015).
234
Y. Jianlong and M. Haigh
learning rate in the logistic model of policy are
provided in Table 2. The substitution parameter
in this model refers to the key parameters that
affect substitution between energy sources. For
the substitution parameter value, this study refers
mainly to the research by Anderson et al.
(2003) which discusses the non-linear behaviour
of this model, and the relationship between the
substitution parameter and the variance of relative price distribution, as well as the basis for the
reference value. The substitution relationship
between energy structure and technology is
shown in Fig. 17. Learning rate is an important
parameter representing new energy technology
progress and cost evolution. McDonald and
Schrattenholzer
4 made initial estimates of the
technological progress rate of various energy
technologies. Later, Kumbaroglu et al., Rout
et al. and Rubin et al.
5 reviewed the estimates in
Table 1 Assumptions of key macroeconomic initial values and parameter values
Name
Value
Source
GDP (gdp)
40.12
China Statistical Yearbook 2011, UoM: RMB trillion
Investment (i)
27.71
Consumption (c)
13.33
Exports (x)
10.70
Imports (m)
9.47
Initial time preference rate (r)
0.03
Refer to the settings of the world’s average level in the DICE and RICE
models (Nordhaus, 2007
a )
Annual decrease rate of time
preference (d r )
0.3%
Capital depreciation rate (d)
5%
Set at 7% by Nordhaus and Yang (1996), Gerlagh et al. (2004) and Popp
(2004), and at 3% by Kumbaroglu et al. (2008
b
). The annual capital
depreciation rate is assumed at 5%
Share of capital (c)
0.31
Refer to Nordhaus (2007), Gerlagh et al. (2004)
Elasticity of substitution (q)
0.40
Initial AEEI
0.70
Refer to the settings of the world’s average level in the DICE and RICE
models (Nordhaus, 2007)
Annual decrease rate of AEEI
0.2%
Lower limit of the share of
exports in GDP (h 1 )
0.40
Based on the share of China’s actual imports and exports in 1995–2011
(China Statistical Yearbook, 1995–2011)
Upper limit of the share of
imports in GDP (h 2 )
0.30
Carbon emissions factor (n)
2
0.645
The calculation method in IPCC Guidelines for National Greenhouse
Gas Inventories
a Nordhaus, W., The Challenge of Global Warming: Economic Models and Environmental Policy. (New Haven, USA,
2007)
b
Nordhaus, W.D. and Yang, Z., A Regional Dynamic General Equilibrium Model of Alternative Climate Change
Strategies. American Economic Review 86, pp. 741–765, (1996). Gerlagh, R., van der Zwaan, B., A sensitivity
Analysis of Timing and Costs of Greenhouse Gas Emission Reductions. Climatic Change 65, pp. 39–71, (2004). Popp,
D., ENTICE: Endogenous Technological Change in the DICE Model of Global Warming. Journal of Environmental
Economics and Management 48, pp. 742–768, (2004). Kumbaroğlu, G., Karali, N. and Arıkan, Y., CO 2 , GDP and
RET: An Aggregate Economic Equilibrium Analysis for Turkey. Energy Policy 36, pp. 2,694–2,708, (2008)
4
McDonald, A., Schrattenholzer. L., Learning Rates for
Energy Technologies. Energy Policy 29, pp. 255–261,
(2001).
5
Rout, U.K., Blesl, M., Fahl, U., Remme, U. and Voß, A,.
Uncertainty in the Learning Rates of Energy Technologies: An Experiment in a Global Multi-regional Energy
System Model. Energy Policy 37, pp. 4,927–4,942,
(2009).Rubin, E. S., Azevedo, I. M. L., Jaramillo,
P. and Yeh, S., A review of Learning Rates for Electricity
Supply Technologies. Energy Policy 86, pp. 198–218,
(2015).
234
Y. Jianlong and M. Haigh