

activities from the greenhouse effect caused by
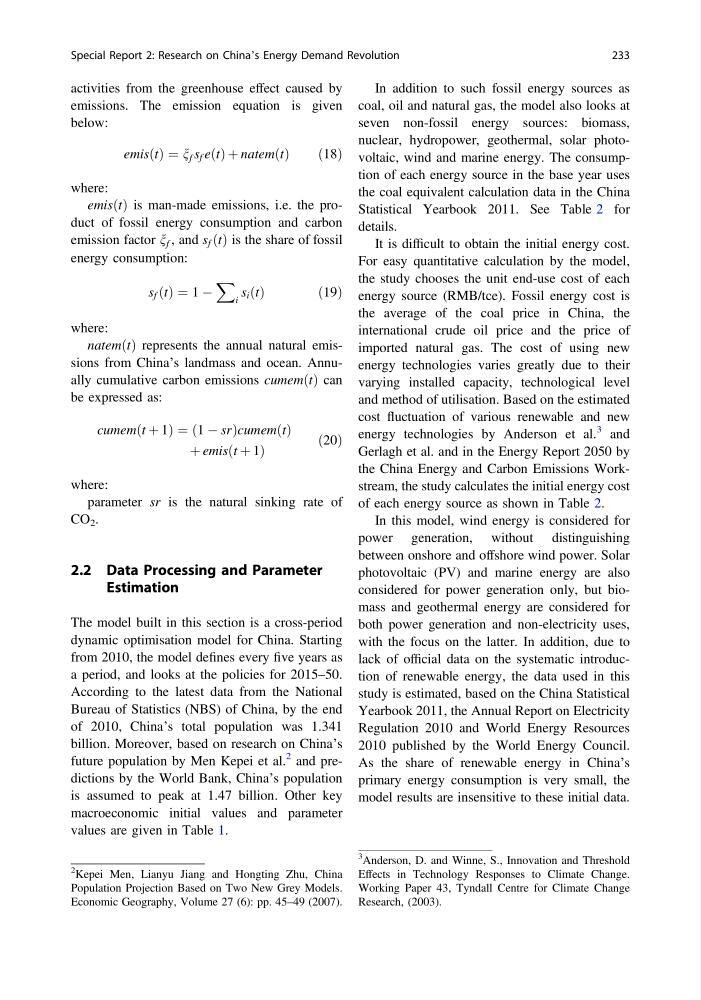
emissions. The emission equation is given
below:
emisðtÞ ¼ n f s f eðtÞ þ natemðtÞ
ð18Þ
where:
emisðtÞ is man-made emissions, i.e. the product of fossil energy consumption and carbon
emission factor n f , and s f ðtÞ is the share of fossil
energy consumption:
s f ðtÞ ¼ 1 À
X
i
s i ðtÞ
ð 19Þ
where:
natemðtÞ represents the annual natural emissions from China’s landmass and ocean. Annually cumulative carbon emissions cumemðtÞ can
be expressed as:
cumemðt þ 1Þ ¼ ð1 À srÞcumemðtÞ
þ emisðt þ 1Þ
ð20Þ
where:
parameter sr is the natural sinking rate of
CO 2 .
2.2 Data Processing and Parameter
Estimation
The model built in this section is a cross-period
dynamic optimisation model for China. Starting
from 2010, the model defines every five years as
a period, and looks at the policies for 2015–50.
According to the latest data from the National
Bureau of Statistics (NBS) of China, by the end
of 2010, China’s total population was 1.341
billion. Moreover, based on research on China’s
future population by Men Kepei et al.
2 and predictions by the World Bank, China’s population
is assumed to peak at 1.47 billion. Other key
macroeconomic initial values and parameter
values are given in Table 1.
In addition to such fossil energy sources as
coal, oil and natural gas, the model also looks at
seven non-fossil energy sources: biomass,
nuclear, hydropower, geothermal, solar photovoltaic, wind and marine energy. The consumption of each energy source in the base year uses
the coal equivalent calculation data in the China
Statistical Yearbook 2011. See Table 2 for
details.
It is difficult to obtain the initial energy cost.
For easy quantitative calculation by the model,
the study chooses the unit end-use cost of each
energy source (RMB/tce). Fossil energy cost is
the average of the coal price in China, the
international crude oil price and the price of
imported natural gas. The cost of using new
energy technologies varies greatly due to their
varying installed capacity, technological level
and method of utilisation. Based on the estimated
cost fluctuation of various renewable and new
energy technologies by Anderson et al.
3 and
Gerlagh et al. and in the Energy Report 2050 by
the China Energy and Carbon Emissions Workstream, the study calculates the initial energy cost
of each energy source as shown in Table 2.
In this model, wind energy is considered for
power generation, without distinguishing
between onshore and offshore wind power. Solar
photovoltaic (PV) and marine energy are also
considered for power generation only, but biomass and geothermal energy are considered for
both power generation and non-electricity uses,
with the focus on the latter. In addition, due to
lack of official data on the systematic introduction of renewable energy, the data used in this
study is estimated, based on the China Statistical
Yearbook 2011, the Annual Report on Electricity
Regulation 2010 and World Energy Resources
2010 published by the World Energy Council.
As the share of renewable energy in China’s
primary energy consumption is very small, the
model results are insensitive to these initial data.
2
Kepei Men, Lianyu Jiang and Hongting Zhu, China
Population Projection Based on Two New Grey Models.
Economic Geography, Volume 27 (6): pp. 45–49 (2007).
3
Anderson, D. and Winne, S., Innovation and Threshold
Effects in Technology Responses to Climate Change.
Working Paper 43, Tyndall Centre for Climate Change
Research, (2003).
Special Report 2: Research on China’s Energy Demand Revolution
233
emissions. The emission equation is given
below:
emisðtÞ ¼ n f s f eðtÞ þ natemðtÞ
ð18Þ
where:
emisðtÞ is man-made emissions, i.e. the product of fossil energy consumption and carbon
emission factor n f , and s f ðtÞ is the share of fossil
energy consumption:
s f ðtÞ ¼ 1 À
X
i
s i ðtÞ
ð 19Þ
where:
natemðtÞ represents the annual natural emissions from China’s landmass and ocean. Annually cumulative carbon emissions cumemðtÞ can
be expressed as:
cumemðt þ 1Þ ¼ ð1 À srÞcumemðtÞ
þ emisðt þ 1Þ
ð20Þ
where:
parameter sr is the natural sinking rate of
CO 2 .
2.2 Data Processing and Parameter
Estimation
The model built in this section is a cross-period
dynamic optimisation model for China. Starting
from 2010, the model defines every five years as
a period, and looks at the policies for 2015–50.
According to the latest data from the National
Bureau of Statistics (NBS) of China, by the end
of 2010, China’s total population was 1.341
billion. Moreover, based on research on China’s
future population by Men Kepei et al.
2 and predictions by the World Bank, China’s population
is assumed to peak at 1.47 billion. Other key
macroeconomic initial values and parameter
values are given in Table 1.
In addition to such fossil energy sources as
coal, oil and natural gas, the model also looks at
seven non-fossil energy sources: biomass,
nuclear, hydropower, geothermal, solar photovoltaic, wind and marine energy. The consumption of each energy source in the base year uses
the coal equivalent calculation data in the China
Statistical Yearbook 2011. See Table 2 for
details.
It is difficult to obtain the initial energy cost.
For easy quantitative calculation by the model,
the study chooses the unit end-use cost of each
energy source (RMB/tce). Fossil energy cost is
the average of the coal price in China, the
international crude oil price and the price of
imported natural gas. The cost of using new
energy technologies varies greatly due to their
varying installed capacity, technological level
and method of utilisation. Based on the estimated
cost fluctuation of various renewable and new
energy technologies by Anderson et al.
3 and
Gerlagh et al. and in the Energy Report 2050 by
the China Energy and Carbon Emissions Workstream, the study calculates the initial energy cost
of each energy source as shown in Table 2.
In this model, wind energy is considered for
power generation, without distinguishing
between onshore and offshore wind power. Solar
photovoltaic (PV) and marine energy are also
considered for power generation only, but biomass and geothermal energy are considered for
both power generation and non-electricity uses,
with the focus on the latter. In addition, due to
lack of official data on the systematic introduction of renewable energy, the data used in this
study is estimated, based on the China Statistical
Yearbook 2011, the Annual Report on Electricity
Regulation 2010 and World Energy Resources
2010 published by the World Energy Council.
As the share of renewable energy in China’s
primary energy consumption is very small, the
model results are insensitive to these initial data.
2
Kepei Men, Lianyu Jiang and Hongting Zhu, China
Population Projection Based on Two New Grey Models.
Economic Geography, Volume 27 (6): pp. 45–49 (2007).
3
Anderson, D. and Winne, S., Innovation and Threshold
Effects in Technology Responses to Climate Change.
Working Paper 43, Tyndall Centre for Climate Change
Research, (2003).
Special Report 2: Research on China’s Energy Demand Revolution
233