

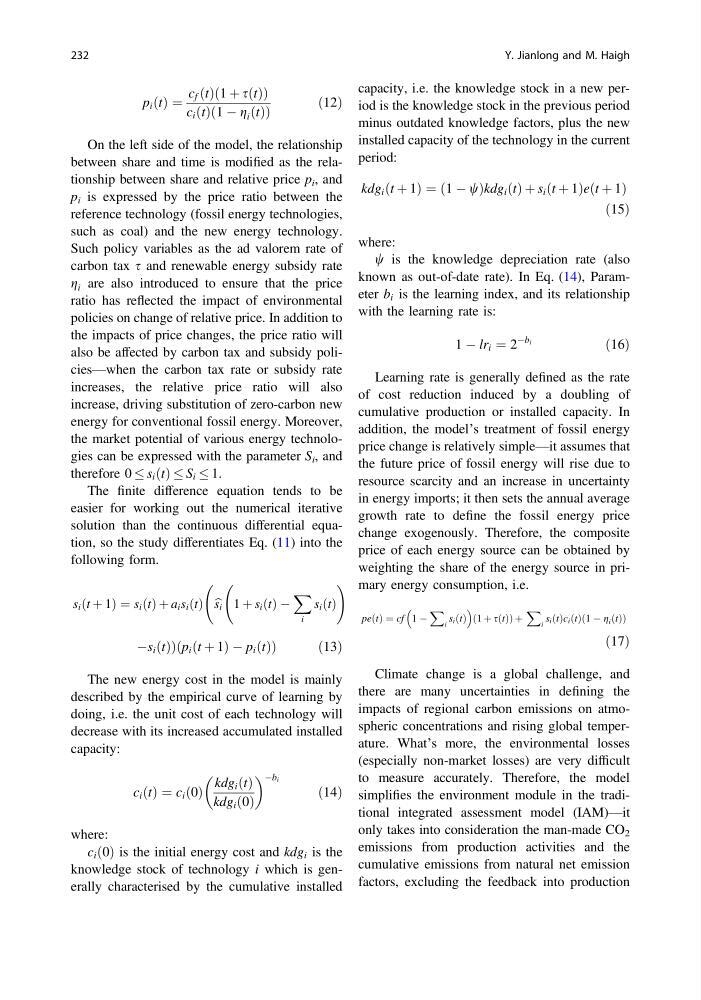
p i ðtÞ ¼
c f ðtÞ 1 þ sðtÞ
ð
Þ
c i ðtÞ 1 À g i ðtÞ
ð
Þ
ð12Þ
On the left side of the model, the relationship
between share and time is modified as the relationship between share and relative price p i , and
p i is expressed by the price ratio between the
reference technology (fossil energy technologies,
such as coal) and the new energy technology.
Such policy variables as the ad valorem rate of
carbon tax s and renewable energy subsidy rate
g i are also introduced to ensure that the price
ratio has reflected the impact of environmental
policies on change of relative price. In addition to
the impacts of price changes, the price ratio will
also be affected by carbon tax and subsidy policies—when the carbon tax rate or subsidy rate
increases, the relative price ratio will also
increase, driving substitution of zero-carbon new
energy for conventional fossil energy. Moreover,
the market potential of various energy technologies can be expressed with the parameter S i , and
therefore 0 s i ðtÞ S i 1.
The finite difference equation tends to be
easier for working out the numerical iterative
solution than the continuous differential equation, so the study differentiates Eq. (11) into the
following form.
s i ðt þ 1Þ ¼ s i ðtÞ þ a i s i ðtÞ b
s i 1 þ s i ðtÞ À
X
i
s i ðtÞ
!
Às i ðtÞÞ p i ðt þ 1Þ À p i ðtÞ
ð
Þ
ð 13Þ
The new energy cost in the model is mainly
described by the empirical curve of learning by
doing, i.e. the unit cost of each technology will
decrease with its increased accumulated installed
capacity:
c i ðtÞ ¼ c i ð0Þ
kdg i ðtÞ
kdg i ð0Þ
Àb i
ð14Þ
where:
c i ð0Þ is the initial energy cost and kdg i is the
knowledge stock of technology i which is generally characterised by the cumulative installed
capacity, i.e. the knowledge stock in a new period is the knowledge stock in the previous period
minus outdated knowledge factors, plus the new
installed capacity of the technology in the current
period:
kdg i ðt þ 1Þ ¼ 1 À w
ð
Þkdg i ðtÞ þ s i ðt þ 1Þeðt þ 1Þ
ð15Þ
where:
w is the knowledge depreciation rate (also
known as out-of-date rate). In Eq. (14), Parameter b i is the learning index, and its relationship
with the learning rate is:
1 À lr i ¼ 2
Àb i
ð16Þ
Learning rate is generally defined as the rate
of cost reduction induced by a doubling of
cumulative production or installed capacity. In
addition, the model’s treatment of fossil energy
price change is relatively simple—it assumes that
the future price of fossil energy will rise due to
resource scarcity and an increase in uncertainty
in energy imports; it then sets the annual average
growth rate to define the fossil energy price
change exogenously. Therefore, the composite
price of each energy source can be obtained by
weighting the share of the energy source in primary energy consumption, i.e.
peðtÞ ¼ cf 1 À
X
i
s i ðtÞ
ð1 þ sðtÞÞ þ
X
i
s i ðtÞc i ðtÞð1 À g i ðtÞÞ
ð17Þ
Climate change is a global challenge, and
there are many uncertainties in defining the
impacts of regional carbon emissions on atmospheric concentrations and rising global temperature. What’s more, the environmental losses
(especially non-market losses) are very difficult
to measure accurately. Therefore, the model
simplifies the environment module in the traditional integrated assessment model (IAM)—it
only takes into consideration the man-made CO 2
emissions from production activities and the
cumulative emissions from natural net emission
factors, excluding the feedback into production
232
Y. Jianlong and M. Haigh
c f ðtÞ 1 þ sðtÞ
ð
Þ
c i ðtÞ 1 À g i ðtÞ
ð
Þ
ð12Þ
On the left side of the model, the relationship
between share and time is modified as the relationship between share and relative price p i , and
p i is expressed by the price ratio between the
reference technology (fossil energy technologies,
such as coal) and the new energy technology.
Such policy variables as the ad valorem rate of
carbon tax s and renewable energy subsidy rate
g i are also introduced to ensure that the price
ratio has reflected the impact of environmental
policies on change of relative price. In addition to
the impacts of price changes, the price ratio will
also be affected by carbon tax and subsidy policies—when the carbon tax rate or subsidy rate
increases, the relative price ratio will also
increase, driving substitution of zero-carbon new
energy for conventional fossil energy. Moreover,
the market potential of various energy technologies can be expressed with the parameter S i , and
therefore 0 s i ðtÞ S i 1.
The finite difference equation tends to be
easier for working out the numerical iterative
solution than the continuous differential equation, so the study differentiates Eq. (11) into the
following form.
s i ðt þ 1Þ ¼ s i ðtÞ þ a i s i ðtÞ b
s i 1 þ s i ðtÞ À
X
i
s i ðtÞ
!
Às i ðtÞÞ p i ðt þ 1Þ À p i ðtÞ
ð
Þ
ð 13Þ
The new energy cost in the model is mainly
described by the empirical curve of learning by
doing, i.e. the unit cost of each technology will
decrease with its increased accumulated installed
capacity:
c i ðtÞ ¼ c i ð0Þ
kdg i ðtÞ
kdg i ð0Þ
Àb i
ð14Þ
where:
c i ð0Þ is the initial energy cost and kdg i is the
knowledge stock of technology i which is generally characterised by the cumulative installed
capacity, i.e. the knowledge stock in a new period is the knowledge stock in the previous period
minus outdated knowledge factors, plus the new
installed capacity of the technology in the current
period:
kdg i ðt þ 1Þ ¼ 1 À w
ð
Þkdg i ðtÞ þ s i ðt þ 1Þeðt þ 1Þ
ð15Þ
where:
w is the knowledge depreciation rate (also
known as out-of-date rate). In Eq. (14), Parameter b i is the learning index, and its relationship
with the learning rate is:
1 À lr i ¼ 2
Àb i
ð16Þ
Learning rate is generally defined as the rate
of cost reduction induced by a doubling of
cumulative production or installed capacity. In
addition, the model’s treatment of fossil energy
price change is relatively simple—it assumes that
the future price of fossil energy will rise due to
resource scarcity and an increase in uncertainty
in energy imports; it then sets the annual average
growth rate to define the fossil energy price
change exogenously. Therefore, the composite
price of each energy source can be obtained by
weighting the share of the energy source in primary energy consumption, i.e.
peðtÞ ¼ cf 1 À
X
i
s i ðtÞ
ð1 þ sðtÞÞ þ
X
i
s i ðtÞc i ðtÞð1 À g i ðtÞÞ
ð17Þ
Climate change is a global challenge, and
there are many uncertainties in defining the
impacts of regional carbon emissions on atmospheric concentrations and rising global temperature. What’s more, the environmental losses
(especially non-market losses) are very difficult
to measure accurately. Therefore, the model
simplifies the environment module in the traditional integrated assessment model (IAM)—it
only takes into consideration the man-made CO 2
emissions from production activities and the
cumulative emissions from natural net emission
factors, excluding the feedback into production
232
Y. Jianlong and M. Haigh