

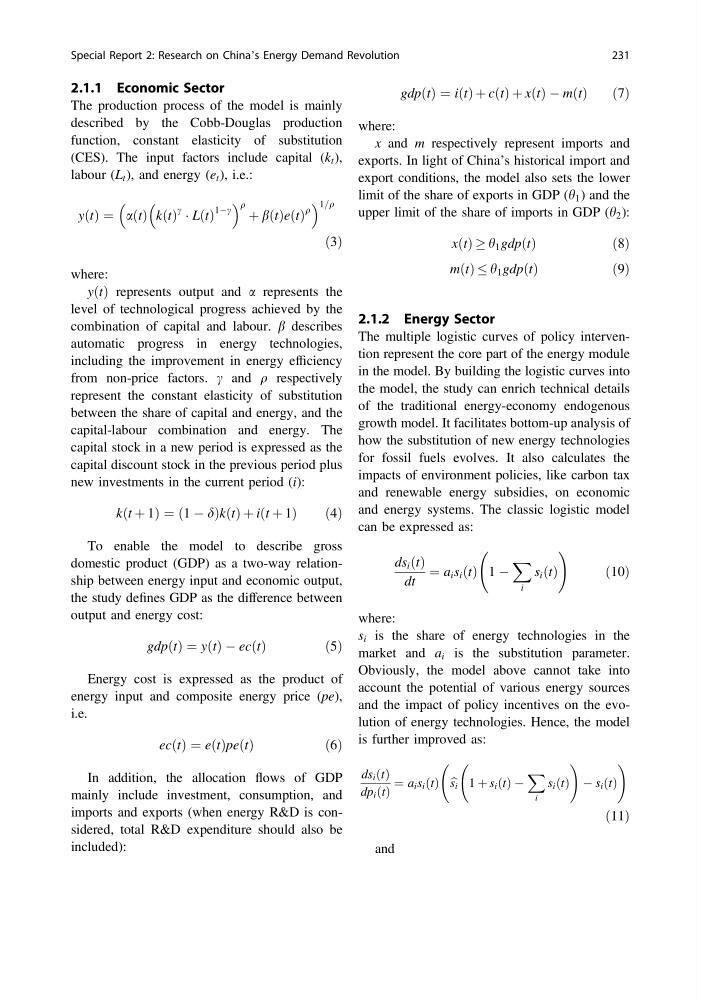
2.1.1 Economic Sector
The production process of the model is mainly
described by the Cobb-Douglas production
function, constant elasticity of substitution
(CES). The input factors include capital (k t ),
labour (L t ), and energy (e t ), i.e.:
yðtÞ ¼ aðtÞ kðtÞ
c Á LðtÞ
1Àc
q þ bðtÞeðtÞ
q
1=q
ð3Þ
where:
yðtÞ represents output and a represents the
level of technological progress achieved by the
combination of capital and labour. b describes
automatic progress in energy technologies,
including the improvement in energy efficiency
from non-price factors. c and q respectively
represent the constant elasticity of substitution
between the share of capital and energy, and the
capital-labour combination and energy. The
capital stock in a new period is expressed as the
capital discount stock in the previous period plus
new investments in the current period (i):
kðt þ 1Þ ¼ ð1 À dÞkðtÞ þ iðt þ 1Þ
ð4Þ
To enable the model to describe gross
domestic product (GDP) as a two-way relationship between energy input and economic output,
the study defines GDP as the difference between
output and energy cost:
gdpðtÞ ¼ yðtÞ À ecðtÞ
ð 5Þ
Energy cost is expressed as the product of
energy input and composite energy price (pe),
i.e.
ecðtÞ ¼ eðtÞpeðtÞ
ð 6Þ
In addition, the allocation flows of GDP
mainly include investment, consumption, and
imports and exports (when energy R&D is considered, total R&D expenditure should also be
included):
gdpðtÞ ¼ iðtÞ þ cðtÞ þ xðtÞ À mðtÞ
ð7Þ
where:
x and m respectively represent imports and
exports. In light of China’s historical import and
export conditions, the model also sets the lower
limit of the share of exports in GDP (h 1 ) and the
upper limit of the share of imports in GDP (h 2 ):
xðtÞ ! h 1 gdpðtÞ
ð 8Þ
mðtÞ h 1 gdpðtÞ
ð 9Þ
2.1.2 Energy Sector
The multiple logistic curves of policy intervention represent the core part of the energy module
in the model. By building the logistic curves into
the model, the study can enrich technical details
of the traditional energy-economy endogenous
growth model. It facilitates bottom-up analysis of
how the substitution of new energy technologies
for fossil fuels evolves. It also calculates the
impacts of environment policies, like carbon tax
and renewable energy subsidies, on economic
and energy systems. The classic logistic model
can be expressed as:
ds i ðtÞ
dt
¼ a i s i ðtÞ 1 À
X
i
s i ðtÞ
!
ð10Þ
where:
s i is the share of energy technologies in the
market and a i is the substitution parameter.
Obviously, the model above cannot take into
account the potential of various energy sources
and the impact of policy incentives on the evolution of energy technologies. Hence, the model
is further improved as:
ds i ðtÞ
dp i ðtÞ
¼ a i s i ðtÞ b
s i 1 þ s i ðtÞ À
X
i
s i ðtÞ
!
À s i ðtÞ
!
ð11Þ
and
Special Report 2: Research on China’s Energy Demand Revolution
231
The production process of the model is mainly
described by the Cobb-Douglas production
function, constant elasticity of substitution
(CES). The input factors include capital (k t ),
labour (L t ), and energy (e t ), i.e.:
yðtÞ ¼ aðtÞ kðtÞ
c Á LðtÞ
1Àc
q þ bðtÞeðtÞ
q
1=q
ð3Þ
where:
yðtÞ represents output and a represents the
level of technological progress achieved by the
combination of capital and labour. b describes
automatic progress in energy technologies,
including the improvement in energy efficiency
from non-price factors. c and q respectively
represent the constant elasticity of substitution
between the share of capital and energy, and the
capital-labour combination and energy. The
capital stock in a new period is expressed as the
capital discount stock in the previous period plus
new investments in the current period (i):
kðt þ 1Þ ¼ ð1 À dÞkðtÞ þ iðt þ 1Þ
ð4Þ
To enable the model to describe gross
domestic product (GDP) as a two-way relationship between energy input and economic output,
the study defines GDP as the difference between
output and energy cost:
gdpðtÞ ¼ yðtÞ À ecðtÞ
ð 5Þ
Energy cost is expressed as the product of
energy input and composite energy price (pe),
i.e.
ecðtÞ ¼ eðtÞpeðtÞ
ð 6Þ
In addition, the allocation flows of GDP
mainly include investment, consumption, and
imports and exports (when energy R&D is considered, total R&D expenditure should also be
included):
gdpðtÞ ¼ iðtÞ þ cðtÞ þ xðtÞ À mðtÞ
ð7Þ
where:
x and m respectively represent imports and
exports. In light of China’s historical import and
export conditions, the model also sets the lower
limit of the share of exports in GDP (h 1 ) and the
upper limit of the share of imports in GDP (h 2 ):
xðtÞ ! h 1 gdpðtÞ
ð 8Þ
mðtÞ h 1 gdpðtÞ
ð 9Þ
2.1.2 Energy Sector
The multiple logistic curves of policy intervention represent the core part of the energy module
in the model. By building the logistic curves into
the model, the study can enrich technical details
of the traditional energy-economy endogenous
growth model. It facilitates bottom-up analysis of
how the substitution of new energy technologies
for fossil fuels evolves. It also calculates the
impacts of environment policies, like carbon tax
and renewable energy subsidies, on economic
and energy systems. The classic logistic model
can be expressed as:
ds i ðtÞ
dt
¼ a i s i ðtÞ 1 À
X
i
s i ðtÞ
!
ð10Þ
where:
s i is the share of energy technologies in the
market and a i is the substitution parameter.
Obviously, the model above cannot take into
account the potential of various energy sources
and the impact of policy incentives on the evolution of energy technologies. Hence, the model
is further improved as:
ds i ðtÞ
dp i ðtÞ
¼ a i s i ðtÞ b
s i 1 þ s i ðtÞ À
X
i
s i ðtÞ
!
À s i ðtÞ
!
ð11Þ
and
Special Report 2: Research on China’s Energy Demand Revolution
231