

very slight growth expected. The difference
between the high and low paths in agricultural
services is largely due to strong cultural factors—
predominantly vegetarian countries such as India
are unlikely to ever have high meat consumption,
while in most South American countries meat
makes up a high percentage of the diet. In
absolute terms, China consumes a large quantity
of meat (28% of global meat and 50% of all
pork), but its meat consumption per capita is still
lower than that in the high path of international
experience. As predicted by the Food and Agriculture Organization of the United Nations
(UNFAO), meat consumption will not change
significantly by 2030, which may be due to a
change in meat-eating behaviour. This can be
seen in the recently revised dietary guidelines
issued by the Chinese Nutrition Society to tackle
the societal and health effects of excessive
meat-eating.
1
Urbanisation enables substantial economies of
scale for cold-storage supply chains, lowering
prices for meat and increasing demand. Urbanisation helps centralise market demand, justifying
the fixed capital expense of large cold-storage
facilities that reduce transport costs for meat
producers. The effect of urbanisation is more
pronounced at lower levels of income: when
disposable income is low, meat is a luxury and
differences in price equate to large changes in
consumption. At higher income levels, meat
becomes a staple and is less sensitive to price
movements. When GDP per capita is $30,000,
the difference in meat demand between high and
low levels of urbanisation accounts for only 17%
of the variation between the high and low
demand paths, whereas it accounts for 39% at
China’s current income levels. It is important for
China to understand the potential impacts on
meat demand of further increases to its high
urbanisation rate, but also the possible effects of
rising income on attitudes towards meat-eating
(Figs. 10 and 11).
1.1.5 Lessons from International
Experience
As suggested by international experience,
China’s energy service demand tends to go
through structural change at its current level of
GDP per capita. Figure 12 clearly shows that
energy service demand changes over time: China
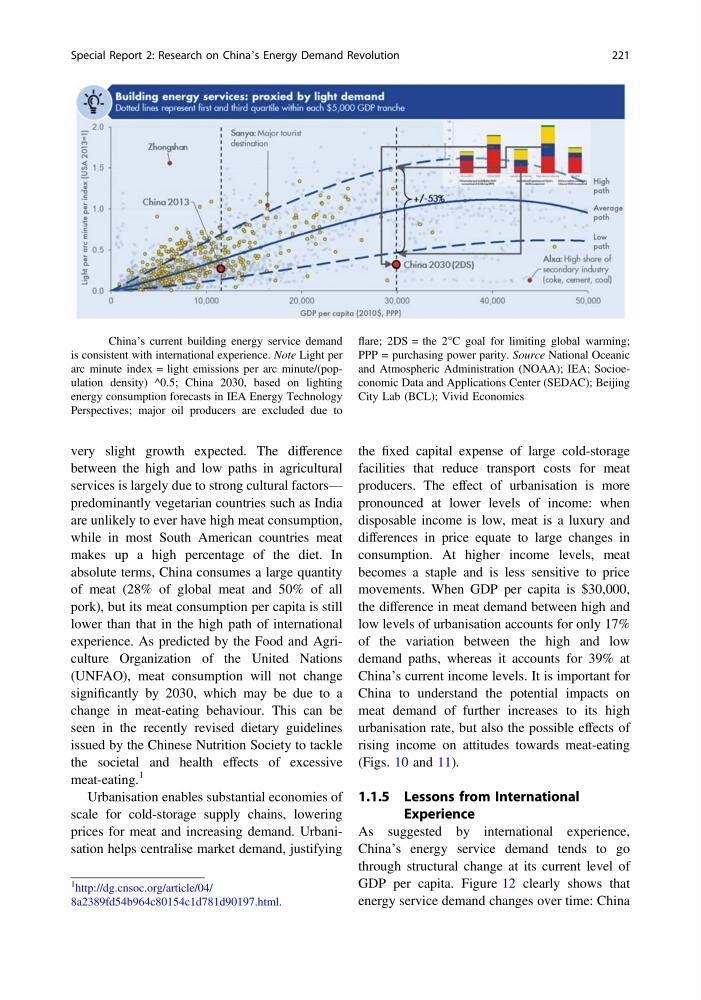
Fig. 9 China’s current building energy service demand
is consistent with international experience. Note Light per
arc minute index = light emissions per arc minute/(population density) ^0.5; China 2030, based on lighting
energy consumption forecasts in IEA Energy Technology
Perspectives; major oil producers are excluded due to
flare; 2DS = the 2°C goal for limiting global warming;
PPP = purchasing power parity. Source National Oceanic
and Atmospheric Administration (NOAA); IEA; Socioeconomic Data and Applications Center (SEDAC); Beijing
City Lab (BCL); Vivid Economics
1
http://dg.cnsoc.org/article/04/
8a2389fd54b964c80154c1d781d90197.html.
Special Report 2: Research on China’s Energy Demand Revolution
221
between the high and low paths in agricultural
services is largely due to strong cultural factors—
predominantly vegetarian countries such as India
are unlikely to ever have high meat consumption,
while in most South American countries meat
makes up a high percentage of the diet. In
absolute terms, China consumes a large quantity
of meat (28% of global meat and 50% of all
pork), but its meat consumption per capita is still
lower than that in the high path of international
experience. As predicted by the Food and Agriculture Organization of the United Nations
(UNFAO), meat consumption will not change
significantly by 2030, which may be due to a
change in meat-eating behaviour. This can be
seen in the recently revised dietary guidelines
issued by the Chinese Nutrition Society to tackle
the societal and health effects of excessive
meat-eating.
1
Urbanisation enables substantial economies of
scale for cold-storage supply chains, lowering
prices for meat and increasing demand. Urbanisation helps centralise market demand, justifying
the fixed capital expense of large cold-storage
facilities that reduce transport costs for meat
producers. The effect of urbanisation is more
pronounced at lower levels of income: when
disposable income is low, meat is a luxury and
differences in price equate to large changes in
consumption. At higher income levels, meat
becomes a staple and is less sensitive to price
movements. When GDP per capita is $30,000,
the difference in meat demand between high and
low levels of urbanisation accounts for only 17%
of the variation between the high and low
demand paths, whereas it accounts for 39% at
China’s current income levels. It is important for
China to understand the potential impacts on
meat demand of further increases to its high
urbanisation rate, but also the possible effects of
rising income on attitudes towards meat-eating
(Figs. 10 and 11).
1.1.5 Lessons from International
Experience
As suggested by international experience,
China’s energy service demand tends to go
through structural change at its current level of
GDP per capita. Figure 12 clearly shows that
energy service demand changes over time: China
Fig. 9 China’s current building energy service demand
is consistent with international experience. Note Light per
arc minute index = light emissions per arc minute/(population density) ^0.5; China 2030, based on lighting
energy consumption forecasts in IEA Energy Technology
Perspectives; major oil producers are excluded due to
flare; 2DS = the 2°C goal for limiting global warming;
PPP = purchasing power parity. Source National Oceanic
and Atmospheric Administration (NOAA); IEA; Socioeconomic Data and Applications Center (SEDAC); Beijing
City Lab (BCL); Vivid Economics
1
http://dg.cnsoc.org/article/04/
8a2389fd54b964c80154c1d781d90197.html.
Special Report 2: Research on China’s Energy Demand Revolution
221