

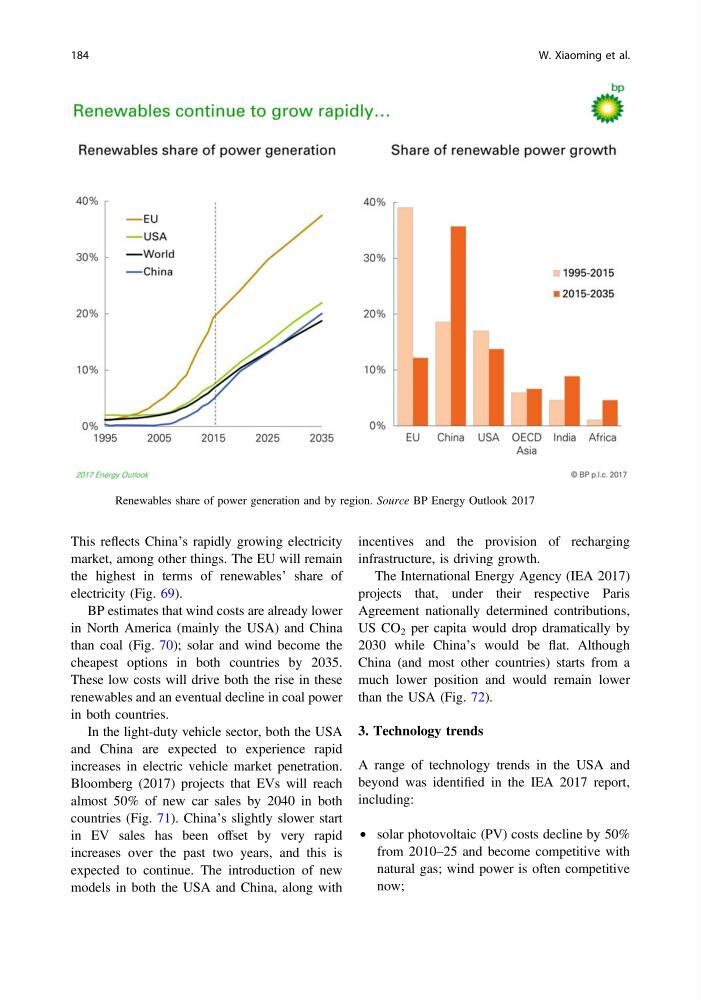
This reflects China’s rapidly growing electricity
market, among other things. The EU will remain
the highest in terms of renewables’ share of
electricity (Fig. 69).
BP estimates that wind costs are already lower
in North America (mainly the USA) and China
than coal (Fig. 70); solar and wind become the
cheapest options in both countries by 2035.
These low costs will drive both the rise in these
renewables and an eventual decline in coal power
in both countries.
In the light-duty vehicle sector, both the USA
and China are expected to experience rapid
increases in electric vehicle market penetration.
Bloomberg (2017) projects that EVs will reach
almost 50% of new car sales by 2040 in both
countries (Fig. 71). China’s slightly slower start
in EV sales has been offset by very rapid
increases over the past two years, and this is
expected to continue. The introduction of new
models in both the USA and China, along with
incentives and the provision of recharging
infrastructure, is driving growth.
The International Energy Agency (IEA 2017)
projects that, under their respective Paris
Agreement nationally determined contributions,
US CO 2 per capita would drop dramatically by
2030 while China’s would be flat. Although
China (and most other countries) starts from a
much lower position and would remain lower
than the USA (Fig. 72).
3. Technology trends
A range of technology trends in the USA and
beyond was identified in the IEA 2017 report,
including:
• solar photovoltaic (PV) costs decline by 50%
from 2010–25 and become competitive with
natural gas; wind power is often competitive
now;
Fig. 69 Renewables share of power generation and by region. Source BP Energy Outlook 2017
184
W. Xiaoming et al.
market, among other things. The EU will remain
the highest in terms of renewables’ share of
electricity (Fig. 69).
BP estimates that wind costs are already lower
in North America (mainly the USA) and China
than coal (Fig. 70); solar and wind become the
cheapest options in both countries by 2035.
These low costs will drive both the rise in these
renewables and an eventual decline in coal power
in both countries.
In the light-duty vehicle sector, both the USA
and China are expected to experience rapid
increases in electric vehicle market penetration.
Bloomberg (2017) projects that EVs will reach
almost 50% of new car sales by 2040 in both
countries (Fig. 71). China’s slightly slower start
in EV sales has been offset by very rapid
increases over the past two years, and this is
expected to continue. The introduction of new
models in both the USA and China, along with
incentives and the provision of recharging
infrastructure, is driving growth.
The International Energy Agency (IEA 2017)
projects that, under their respective Paris
Agreement nationally determined contributions,
US CO 2 per capita would drop dramatically by
2030 while China’s would be flat. Although
China (and most other countries) starts from a
much lower position and would remain lower
than the USA (Fig. 72).
3. Technology trends
A range of technology trends in the USA and
beyond was identified in the IEA 2017 report,
including:
• solar photovoltaic (PV) costs decline by 50%
from 2010–25 and become competitive with
natural gas; wind power is often competitive
now;
Fig. 69 Renewables share of power generation and by region. Source BP Energy Outlook 2017
184
W. Xiaoming et al.