

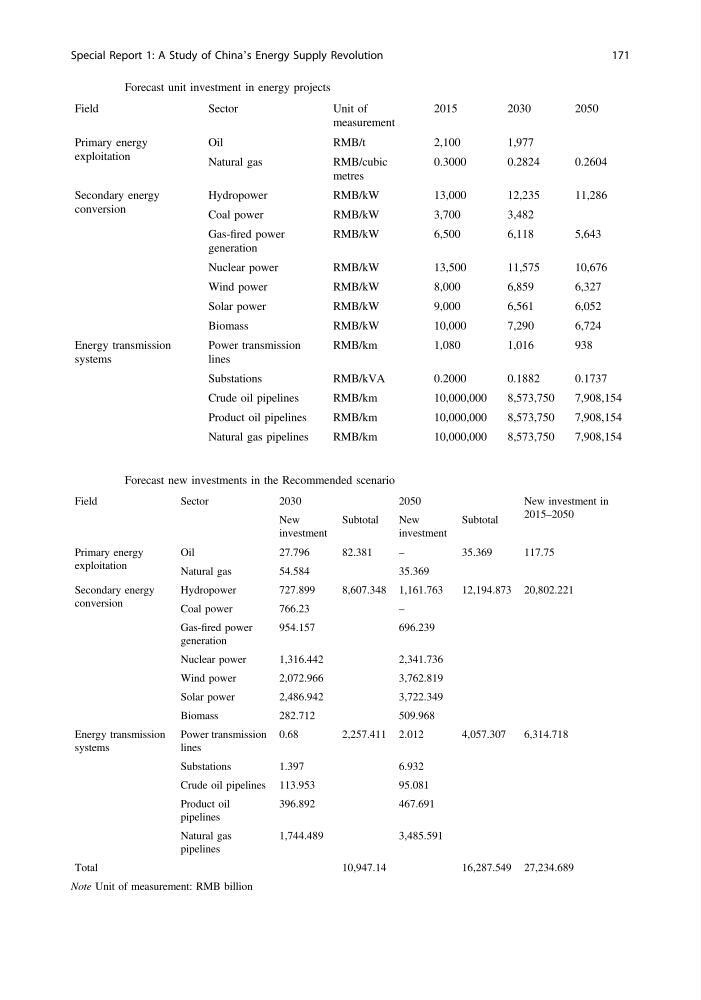
Table 21 Forecast unit investment in energy projects
Field
Sector
Unit of
measurement
2015
2030
2050
Primary energy
exploitation
Oil
RMB/t
2,100
1,977
Natural gas
RMB/cubic
metres
0.3000
0.2824
0.2604
Secondary energy
conversion
Hydropower
RMB/kW
13,000
12,235
11,286
Coal power
RMB/kW
3,700
3,482
Gas-fired power
generation
RMB/kW
6,500
6,118
5,643
Nuclear power
RMB/kW
13,500
11,575
10,676
Wind power
RMB/kW
8,000
6,859
6,327
Solar power
RMB/kW
9,000
6,561
6,052
Biomass
RMB/kW
10,000
7,290
6,724
Energy transmission
systems
Power transmission
lines
RMB/km
1,080
1,016
938
Substations
RMB/kVA
0.2000
0.1882
0.1737
Crude oil pipelines
RMB/km
10,000,000
8,573,750
7,908,154
Product oil pipelines
RMB/km
10,000,000
8,573,750
7,908,154
Natural gas pipelines
RMB/km
10,000,000
8,573,750
7,908,154
Table 22 Forecast new investments in the Recommended scenario
Field
Sector
2030
2050
New investment in
2015–2050
New
investment
Subtotal
New
investment
Subtotal
Primary energy
exploitation
Oil
27.796
82.381
–
35.369
117.75
Natural gas
54.584
35.369
Secondary energy
conversion
Hydropower
727.899
8,607.348 1,161.763
12,194.873 20,802.221
Coal power
766.23
–
Gas-fired power
generation
954.157
696.239
Nuclear power
1,316.442
2,341.736
Wind power
2,072.966
3,762.819
Solar power
2,486.942
3,722.349
Biomass
282.712
509.968
Energy transmission
systems
Power transmission
lines
0.68
2,257.411 2.012
4,057.307
6,314.718
Substations
1.397
6.932
Crude oil pipelines 113.953
95.081
Product oil
pipelines
396.892
467.691
Natural gas
pipelines
1,744.489
3,485.591
Total
10,947.14
16,287.549 27,234.689
Note Unit of measurement: RMB billion
Special Report 1: A Study of China’s Energy Supply Revolution
171
Field
Sector
Unit of
measurement
2015
2030
2050
Primary energy
exploitation
Oil
RMB/t
2,100
1,977
Natural gas
RMB/cubic
metres
0.3000
0.2824
0.2604
Secondary energy
conversion
Hydropower
RMB/kW
13,000
12,235
11,286
Coal power
RMB/kW
3,700
3,482
Gas-fired power
generation
RMB/kW
6,500
6,118
5,643
Nuclear power
RMB/kW
13,500
11,575
10,676
Wind power
RMB/kW
8,000
6,859
6,327
Solar power
RMB/kW
9,000
6,561
6,052
Biomass
RMB/kW
10,000
7,290
6,724
Energy transmission
systems
Power transmission
lines
RMB/km
1,080
1,016
938
Substations
RMB/kVA
0.2000
0.1882
0.1737
Crude oil pipelines
RMB/km
10,000,000
8,573,750
7,908,154
Product oil pipelines
RMB/km
10,000,000
8,573,750
7,908,154
Natural gas pipelines
RMB/km
10,000,000
8,573,750
7,908,154
Table 22 Forecast new investments in the Recommended scenario
Field
Sector
2030
2050
New investment in
2015–2050
New
investment
Subtotal
New
investment
Subtotal
Primary energy
exploitation
Oil
27.796
82.381
–
35.369
117.75
Natural gas
54.584
35.369
Secondary energy
conversion
Hydropower
727.899
8,607.348 1,161.763
12,194.873 20,802.221
Coal power
766.23
–
Gas-fired power
generation
954.157
696.239
Nuclear power
1,316.442
2,341.736
Wind power
2,072.966
3,762.819
Solar power
2,486.942
3,722.349
Biomass
282.712
509.968
Energy transmission
systems
Power transmission
lines
0.68
2,257.411 2.012
4,057.307
6,314.718
Substations
1.397
6.932
Crude oil pipelines 113.953
95.081
Product oil
pipelines
396.892
467.691
Natural gas
pipelines
1,744.489
3,485.591
Total
10,947.14
16,287.549 27,234.689
Note Unit of measurement: RMB billion
Special Report 1: A Study of China’s Energy Supply Revolution
171