

lowering costs and strengthening weaknesses.
Cutting overcapacity will result in large-scale
outflows of personnel from conventional energy
sectors like coal, causing severe unemployment
and reemployment difficulties. On the other
hand, the rapidly developing clean energy sector
urgently needs a large number of highly qualified
people, creating considerable employment
opportunities for those with the right skills.
As the energy revolution deepens, China’s
modernised and technologically more advanced
energy industry will place higher demands on the
labour force. In short, more quality and less
quantity will be required. Moreover, industrial,
regional and structural imbalances in the workforce will become evident.
6.4.1 Industrial Structure
of Employment
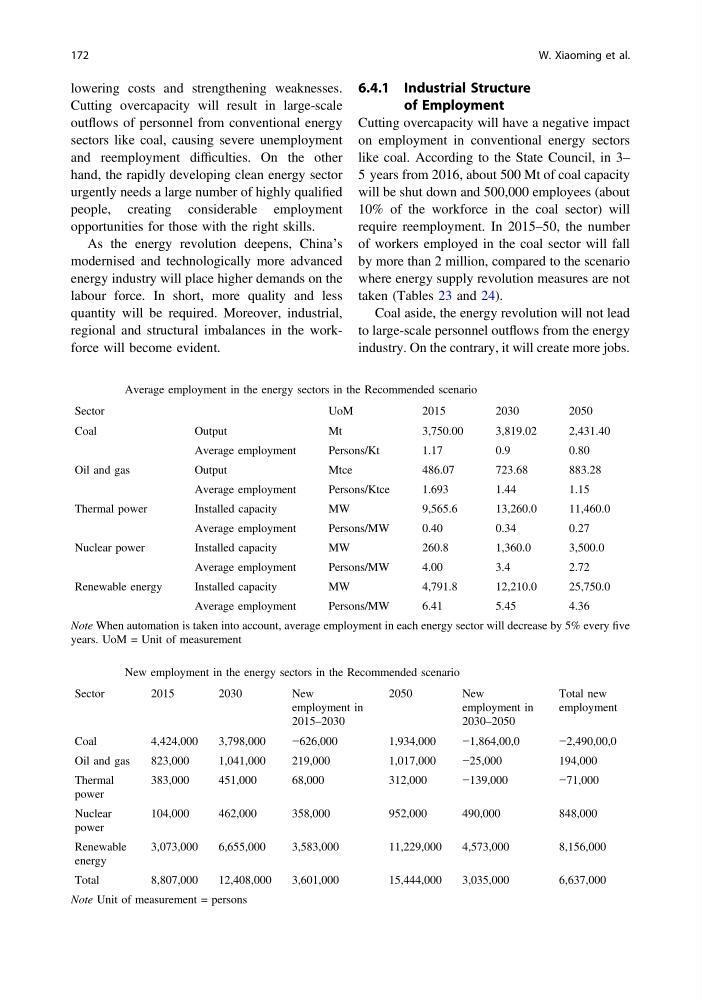
Cutting overcapacity will have a negative impact
on employment in conventional energy sectors
like coal. According to the State Council, in 3–
5 years from 2016, about 500 Mt of coal capacity
will be shut down and 500,000 employees (about
10% of the workforce in the coal sector) will
require reemployment. In 2015–50, the number
of workers employed in the coal sector will fall
by more than 2 million, compared to the scenario
where energy supply revolution measures are not
taken (Tables 23 and 24).
Coal aside, the energy revolution will not lead
to large-scale personnel outflows from the energy
industry. On the contrary, it will create more jobs.
Table 23 Average employment in the energy sectors in the Recommended scenario
Sector
UoM
2015
2030
2050
Coal
Output
Mt
3,750.00
3,819.02
2,431.40
Average employment
Persons/Kt
1.17
0.9
0.80
Oil and gas
Output
Mtce
486.07
723.68
883.28
Average employment
Persons/Ktce
1.693
1.44
1.15
Thermal power
Installed capacity
MW
9,565.6
13,260.0
11,460.0
Average employment
Persons/MW
0.40
0.34
0.27
Nuclear power
Installed capacity
MW
260.8
1,360.0
3,500.0
Average employment
Persons/MW
4.00
3.4
2.72
Renewable energy
Installed capacity
MW
4,791.8
12,210.0
25,750.0
Average employment
Persons/MW
6.41
5.45
4.36
Note When automation is taken into account, average employment in each energy sector will decrease by 5% every five
years. UoM = Unit of measurement
Table 24 New employment in the energy sectors in the Recommended scenario
Sector
2015
2030
New
employment in
2015–2030
2050
New
employment in
2030–2050
Total new
employment
Coal
4,424,000
3,798,000
−626,000
1,934,000
−1,864,00,0
−2,490,00,0
Oil and gas
823,000
1,041,000
219,000
1,017,000
−25,000
194,000
Thermal
power
383,000
451,000
68,000
312,000
−139,000
−71,000
Nuclear
power
104,000
462,000
358,000
952,000
490,000
848,000
Renewable
energy
3,073,000
6,655,000
3,583,000
11,229,000
4,573,000
8,156,000
Total
8,807,000
12,408,000
3,601,000
15,444,000
3,035,000
6,637,000
Note Unit of measurement = persons
172
W. Xiaoming et al.
Cutting overcapacity will result in large-scale
outflows of personnel from conventional energy
sectors like coal, causing severe unemployment
and reemployment difficulties. On the other
hand, the rapidly developing clean energy sector
urgently needs a large number of highly qualified
people, creating considerable employment
opportunities for those with the right skills.
As the energy revolution deepens, China’s
modernised and technologically more advanced
energy industry will place higher demands on the
labour force. In short, more quality and less
quantity will be required. Moreover, industrial,
regional and structural imbalances in the workforce will become evident.
6.4.1 Industrial Structure
of Employment
Cutting overcapacity will have a negative impact
on employment in conventional energy sectors
like coal. According to the State Council, in 3–
5 years from 2016, about 500 Mt of coal capacity
will be shut down and 500,000 employees (about
10% of the workforce in the coal sector) will
require reemployment. In 2015–50, the number
of workers employed in the coal sector will fall
by more than 2 million, compared to the scenario
where energy supply revolution measures are not
taken (Tables 23 and 24).
Coal aside, the energy revolution will not lead
to large-scale personnel outflows from the energy
industry. On the contrary, it will create more jobs.
Table 23 Average employment in the energy sectors in the Recommended scenario
Sector
UoM
2015
2030
2050
Coal
Output
Mt
3,750.00
3,819.02
2,431.40
Average employment
Persons/Kt
1.17
0.9
0.80
Oil and gas
Output
Mtce
486.07
723.68
883.28
Average employment
Persons/Ktce
1.693
1.44
1.15
Thermal power
Installed capacity
MW
9,565.6
13,260.0
11,460.0
Average employment
Persons/MW
0.40
0.34
0.27
Nuclear power
Installed capacity
MW
260.8
1,360.0
3,500.0
Average employment
Persons/MW
4.00
3.4
2.72
Renewable energy
Installed capacity
MW
4,791.8
12,210.0
25,750.0
Average employment
Persons/MW
6.41
5.45
4.36
Note When automation is taken into account, average employment in each energy sector will decrease by 5% every five
years. UoM = Unit of measurement
Table 24 New employment in the energy sectors in the Recommended scenario
Sector
2015
2030
New
employment in
2015–2030
2050
New
employment in
2030–2050
Total new
employment
Coal
4,424,000
3,798,000
−626,000
1,934,000
−1,864,00,0
−2,490,00,0
Oil and gas
823,000
1,041,000
219,000
1,017,000
−25,000
194,000
Thermal
power
383,000
451,000
68,000
312,000
−139,000
−71,000
Nuclear
power
104,000
462,000
358,000
952,000
490,000
848,000
Renewable
energy
3,073,000
6,655,000
3,583,000
11,229,000
4,573,000
8,156,000
Total
8,807,000
12,408,000
3,601,000
15,444,000
3,035,000
6,637,000
Note Unit of measurement = persons
172
W. Xiaoming et al.