

respectively, which requires new installed
capacity of 6, 10, 30 and 30 GW respectively per
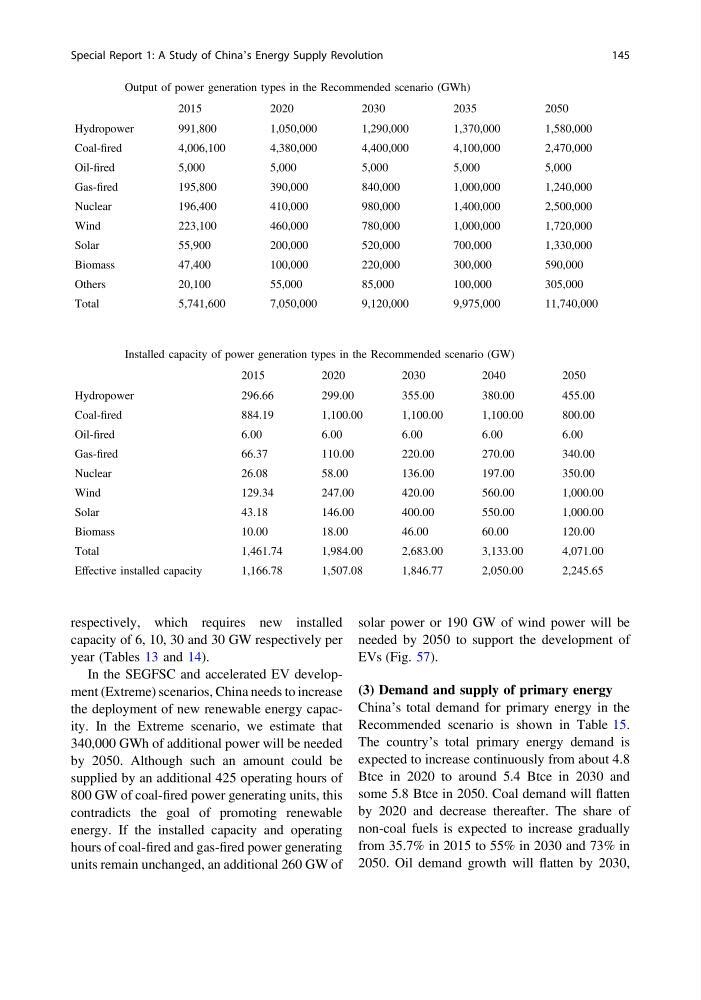
year (Tables 13 and 14).
In the SEGFSC and accelerated EV development (Extreme) scenarios, China needs to increase
the deployment of new renewable energy capacity. In the Extreme scenario, we estimate that
340,000 GWh of additional power will be needed
by 2050. Although such an amount could be
supplied by an additional 425 operating hours of
800 GW of coal-fired power generating units, this
contradicts the goal of promoting renewable
energy. If the installed capacity and operating
hours of coal-fired and gas-fired power generating
units remain unchanged, an additional 260 GW of
solar power or 190 GW of wind power will be
needed by 2050 to support the development of
EVs (Fig. 57).
(3) Demand and supply of primary energy
China’s total demand for primary energy in the
Recommended scenario is shown in Table 15.
The country’s total primary energy demand is
expected to increase continuously from about 4.8
Btce in 2020 to around 5.4 Btce in 2030 and
some 5.8 Btce in 2050. Coal demand will flatten
by 2020 and decrease thereafter. The share of
non-coal fuels is expected to increase gradually
from 35.7% in 2015 to 55% in 2030 and 73% in
2050. Oil demand growth will flatten by 2030,
Table 13 Output of power generation types in the Recommended scenario (GWh)
2015
2020
2030
2035
2050
Hydropower
991,800
1,050,000
1,290,000
1,370,000
1,580,000
Coal-fired
4,006,100
4,380,000
4,400,000
4,100,000
2,470,000
Oil-fired
5,000
5,000
5,000
5,000
5,000
Gas-fired
195,800
390,000
840,000
1,000,000
1,240,000
Nuclear
196,400
410,000
980,000
1,400,000
2,500,000
Wind
223,100
460,000
780,000
1,000,000
1,720,000
Solar
55,900
200,000
520,000
700,000
1,330,000
Biomass
47,400
100,000
220,000
300,000
590,000
Others
20,100
55,000
85,000
100,000
305,000
Total
5,741,600
7,050,000
9,120,000
9,975,000
11,740,000
Table 14 Installed capacity of power generation types in the Recommended scenario (GW)
2015
2020
2030
2040
2050
Hydropower
296.66
299.00
355.00
380.00
455.00
Coal-fired
884.19
1,100.00
1,100.00
1,100.00
800.00
Oil-fired
6.00
6.00
6.00
6.00
6.00
Gas-fired
66.37
110.00
220.00
270.00
340.00
Nuclear
26.08
58.00
136.00
197.00
350.00
Wind
129.34
247.00
420.00
560.00
1,000.00
Solar
43.18
146.00
400.00
550.00
1,000.00
Biomass
10.00
18.00
46.00
60.00
120.00
Total
1,461.74
1,984.00
2,683.00
3,133.00
4,071.00
Effective installed capacity
1,166.78
1,507.08
1,846.77
2,050.00
2,245.65
Special Report 1: A Study of China’s Energy Supply Revolution
145
capacity of 6, 10, 30 and 30 GW respectively per
year (Tables 13 and 14).
In the SEGFSC and accelerated EV development (Extreme) scenarios, China needs to increase
the deployment of new renewable energy capacity. In the Extreme scenario, we estimate that
340,000 GWh of additional power will be needed
by 2050. Although such an amount could be
supplied by an additional 425 operating hours of
800 GW of coal-fired power generating units, this
contradicts the goal of promoting renewable
energy. If the installed capacity and operating
hours of coal-fired and gas-fired power generating
units remain unchanged, an additional 260 GW of
solar power or 190 GW of wind power will be
needed by 2050 to support the development of
EVs (Fig. 57).
(3) Demand and supply of primary energy
China’s total demand for primary energy in the
Recommended scenario is shown in Table 15.
The country’s total primary energy demand is
expected to increase continuously from about 4.8
Btce in 2020 to around 5.4 Btce in 2030 and
some 5.8 Btce in 2050. Coal demand will flatten
by 2020 and decrease thereafter. The share of
non-coal fuels is expected to increase gradually
from 35.7% in 2015 to 55% in 2030 and 73% in
2050. Oil demand growth will flatten by 2030,
Table 13 Output of power generation types in the Recommended scenario (GWh)
2015
2020
2030
2035
2050
Hydropower
991,800
1,050,000
1,290,000
1,370,000
1,580,000
Coal-fired
4,006,100
4,380,000
4,400,000
4,100,000
2,470,000
Oil-fired
5,000
5,000
5,000
5,000
5,000
Gas-fired
195,800
390,000
840,000
1,000,000
1,240,000
Nuclear
196,400
410,000
980,000
1,400,000
2,500,000
Wind
223,100
460,000
780,000
1,000,000
1,720,000
Solar
55,900
200,000
520,000
700,000
1,330,000
Biomass
47,400
100,000
220,000
300,000
590,000
Others
20,100
55,000
85,000
100,000
305,000
Total
5,741,600
7,050,000
9,120,000
9,975,000
11,740,000
Table 14 Installed capacity of power generation types in the Recommended scenario (GW)
2015
2020
2030
2040
2050
Hydropower
296.66
299.00
355.00
380.00
455.00
Coal-fired
884.19
1,100.00
1,100.00
1,100.00
800.00
Oil-fired
6.00
6.00
6.00
6.00
6.00
Gas-fired
66.37
110.00
220.00
270.00
340.00
Nuclear
26.08
58.00
136.00
197.00
350.00
Wind
129.34
247.00
420.00
560.00
1,000.00
Solar
43.18
146.00
400.00
550.00
1,000.00
Biomass
10.00
18.00
46.00
60.00
120.00
Total
1,461.74
1,984.00
2,683.00
3,133.00
4,071.00
Effective installed capacity
1,166.78
1,507.08
1,846.77
2,050.00
2,245.65
Special Report 1: A Study of China’s Energy Supply Revolution
145