

Solutions des exercices
273
Tableau 12.8 CALCUL DE LA SUITE D’ÉCHANTILLONS DE SORTIE.
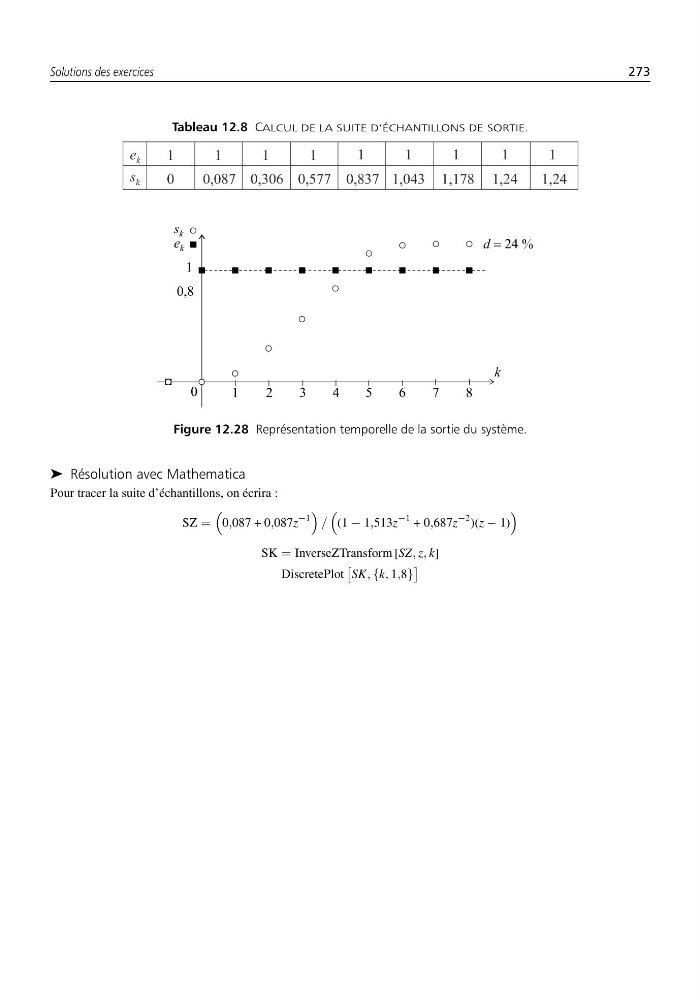
Figure 12.28 Représentation temporelle de la sortie du système.
➤ Résolution avec Mathematica
Pour tracer la suite d’échantillons, on écrira :
SZ =
0,087 + 0,087z
−1
/
(1 − 1,513z
−1 + 0,687z
−2 )(z − 1)
SK = InverseZTransform [SZ, z, k]
DiscretePlot
SK, {k, 1,8}
273
Tableau 12.8 CALCUL DE LA SUITE D’ÉCHANTILLONS DE SORTIE.
Figure 12.28 Représentation temporelle de la sortie du système.
➤ Résolution avec Mathematica
Pour tracer la suite d’échantillons, on écrira :
SZ =
0,087 + 0,087z
−1
/
(1 − 1,513z
−1 + 0,687z
−2 )(z − 1)
SK = InverseZTransform [SZ, z, k]
DiscretePlot
SK, {k, 1,8}