

5 The Effective Elements in Responding …
45
5.3.3 Analysis of Data
The data remained established from 32 respondents by utilizing the reliability analysis, normality test and the multiple correlation analysis from the Statistical Package
for Social Science (SPSS), version 25.
5.3.4 The Background of Respondents
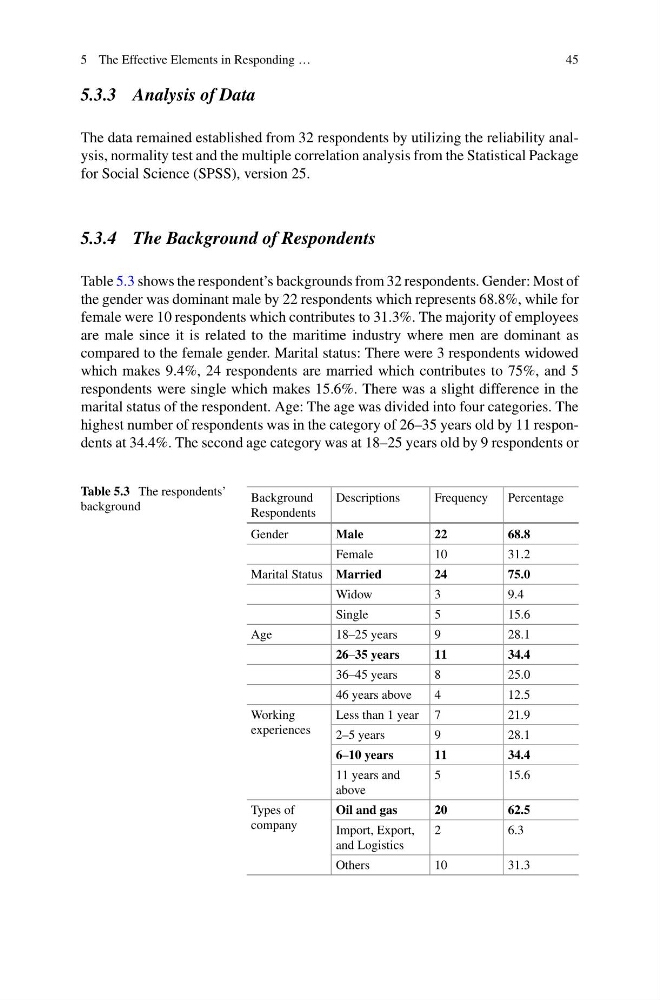
Table 5.3 shows the respondent’s backgrounds from 32 respondents. Gender: Most of
the gender was dominant male by 22 respondents which represents 68.8%, while for
female were 10 respondents which contributes to 31.3%. The majority of employees
are male since it is related to the maritime industry where men are dominant as
compared to the female gender. Marital status: There were 3 respondents widowed
which makes 9.4%, 24 respondents are married which contributes to 75%, and 5
respondents were single which makes 15.6%. There was a slight difference in the
marital status of the respondent. Age: The age was divided into four categories. The
highest number of respondents was in the category of 26–35 years old by 11 respondents at 34.4%. The second age category was at 18–25 years old by 9 respondents or
Table 5.3 The respondents’
background
Background
Respondents
Descriptions
Frequency
Percentage
Gender
Male
22
68.8
Female
10
31.2
Marital Status Married
24
75.0
Widow
3
9.4
Single
5
15.6
Age
18–25 years
9
28.1
26–35 years
11
34.4
36–45 years
8
25.0
46 years above
4
12.5
Working
experiences
Less than 1 year 7
21.9
2–5 years
9
28.1
6–10 years
11
34.4
11 years and
above
5
15.6
Types of
company
Oil and gas
20
62.5
Import, Export,
and Logistics
2
6.3
Others
10
31.3
45
5.3.3 Analysis of Data
The data remained established from 32 respondents by utilizing the reliability analysis, normality test and the multiple correlation analysis from the Statistical Package
for Social Science (SPSS), version 25.
5.3.4 The Background of Respondents
Table 5.3 shows the respondent’s backgrounds from 32 respondents. Gender: Most of
the gender was dominant male by 22 respondents which represents 68.8%, while for
female were 10 respondents which contributes to 31.3%. The majority of employees
are male since it is related to the maritime industry where men are dominant as
compared to the female gender. Marital status: There were 3 respondents widowed
which makes 9.4%, 24 respondents are married which contributes to 75%, and 5
respondents were single which makes 15.6%. There was a slight difference in the
marital status of the respondent. Age: The age was divided into four categories. The
highest number of respondents was in the category of 26–35 years old by 11 respondents at 34.4%. The second age category was at 18–25 years old by 9 respondents or
Table 5.3 The respondents’
background
Background
Respondents
Descriptions
Frequency
Percentage
Gender
Male
22
68.8
Female
10
31.2
Marital Status Married
24
75.0
Widow
3
9.4
Single
5
15.6
Age
18–25 years
9
28.1
26–35 years
11
34.4
36–45 years
8
25.0
46 years above
4
12.5
Working
experiences
Less than 1 year 7
21.9
2–5 years
9
28.1
6–10 years
11
34.4
11 years and
above
5
15.6
Types of
company
Oil and gas
20
62.5
Import, Export,
and Logistics
2
6.3
Others
10
31.3