

46
I. C. Ishak et al.
Table 5.4 Summary of Cronbach’s Alpha
Item
Scale means if an
item deleted
Scale variance
if item deleted
Corrected
Item-Total
Correlation
Cronbach’s
alpha if item
deleted
28 items
117.65–118.19
83.96–89.71
0.175–0.633
0.864–0.939
Table 5.5 Cronbach’s alpha
interpretation
Cronbach’s Alpha Value
Description
More than 0.9
Excellent
0.8
Good
0.7
Acceptable
0.6
Quotable
0.5
Poor
Less than 0.5
Unacceptable
at 28.1%. Age category of 36–45 years old was represented by 8 respondents or at
25% and followed by the last age category at 46 years old and above at 12.5% or by
4 respondents. Working experiences: The highest percentage was at 6–10 years by
34.4%. The second highest was at 2–5 years by 28.1%. Working less than 1 year was
by 21.9% and for 11 years and above was by 5 respondents or 15.6%. Types of the
sector: The most dominant sector was oil and gas which was 20 respondents or by
62.5%. This is due to the fact that the marine industry in Lumut is monopolized by
the oil and gas industry. The second sector was others which contributes by 31.3%,
and 6.3% represented by import, export, and logistics companies.
5.3.5 The Cronbach’s Alpha
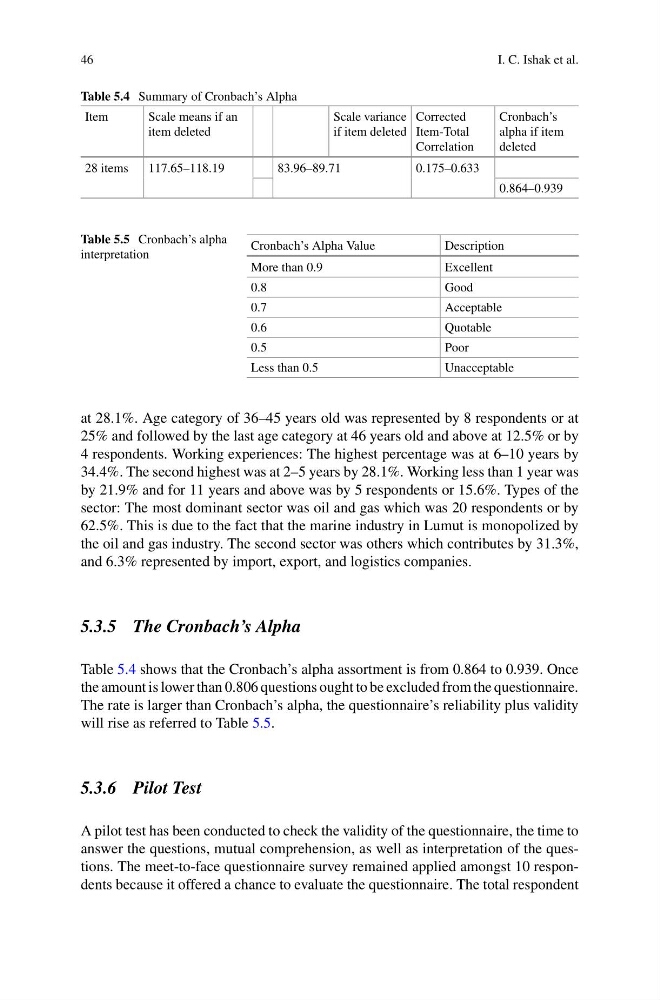
Table 5.4 shows that the Cronbach’s alpha assortment is from 0.864 to 0.939. Once
the amount is lower than 0.806 questions ought to be excluded from the questionnaire.
The rate is larger than Cronbach’s alpha, the questionnaire’s reliability plus validity
will rise as referred to Table 5.5.
5.3.6 Pilot Test
A pilot test has been conducted to check the validity of the questionnaire, the time to
answer the questions, mutual comprehension, as well as interpretation of the questions. The meet-to-face questionnaire survey remained applied amongst 10 respondents because it offered a chance to evaluate the questionnaire. The total respondent
I. C. Ishak et al.
Table 5.4 Summary of Cronbach’s Alpha
Item
Scale means if an
item deleted
Scale variance
if item deleted
Corrected
Item-Total
Correlation
Cronbach’s
alpha if item
deleted
28 items
117.65–118.19
83.96–89.71
0.175–0.633
0.864–0.939
Table 5.5 Cronbach’s alpha
interpretation
Cronbach’s Alpha Value
Description
More than 0.9
Excellent
0.8
Good
0.7
Acceptable
0.6
Quotable
0.5
Poor
Less than 0.5
Unacceptable
at 28.1%. Age category of 36–45 years old was represented by 8 respondents or at
25% and followed by the last age category at 46 years old and above at 12.5% or by
4 respondents. Working experiences: The highest percentage was at 6–10 years by
34.4%. The second highest was at 2–5 years by 28.1%. Working less than 1 year was
by 21.9% and for 11 years and above was by 5 respondents or 15.6%. Types of the
sector: The most dominant sector was oil and gas which was 20 respondents or by
62.5%. This is due to the fact that the marine industry in Lumut is monopolized by
the oil and gas industry. The second sector was others which contributes by 31.3%,
and 6.3% represented by import, export, and logistics companies.
5.3.5 The Cronbach’s Alpha
Table 5.4 shows that the Cronbach’s alpha assortment is from 0.864 to 0.939. Once
the amount is lower than 0.806 questions ought to be excluded from the questionnaire.
The rate is larger than Cronbach’s alpha, the questionnaire’s reliability plus validity
will rise as referred to Table 5.5.
5.3.6 Pilot Test
A pilot test has been conducted to check the validity of the questionnaire, the time to
answer the questions, mutual comprehension, as well as interpretation of the questions. The meet-to-face questionnaire survey remained applied amongst 10 respondents because it offered a chance to evaluate the questionnaire. The total respondent