

4 Hybrid Composite Fiberglass Structure with Embedded …
35
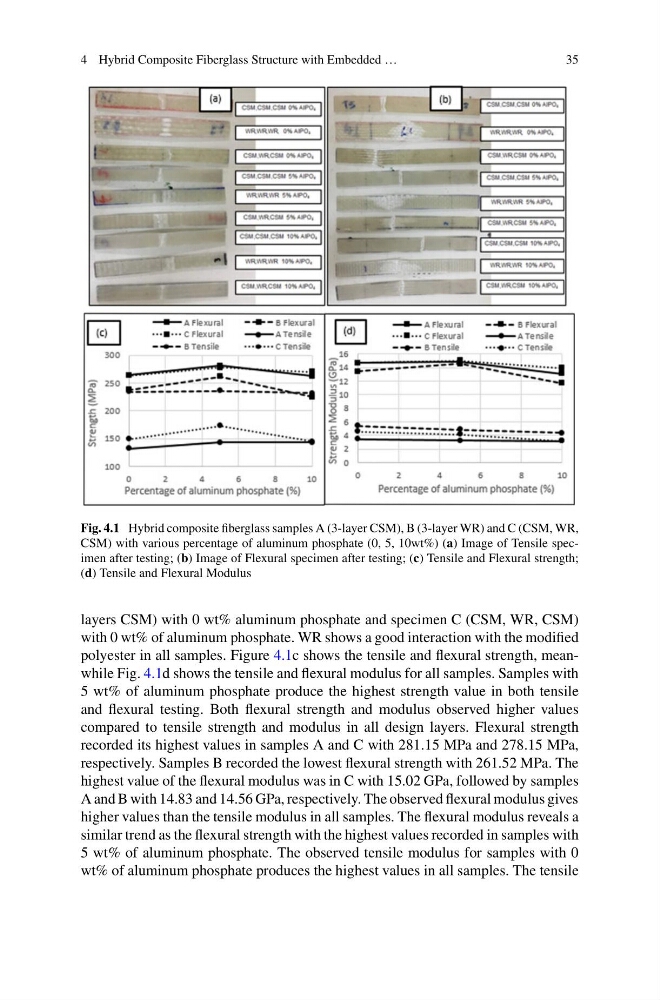
Fig. 4.1 Hybrid composite fiberglass samples A (3-layer CSM), B (3-layer WR) and C (CSM, WR,
CSM) with various percentage of aluminum phosphate (0, 5, 10wt%) (a) Image of Tensile specimen after testing; (b) Image of Flexural specimen after testing; (c) Tensile and Flexural strength;
(d) Tensile and Flexural Modulus
layers CSM) with 0 wt% aluminum phosphate and specimen C (CSM, WR, CSM)
with 0 wt% of aluminum phosphate. WR shows a good interaction with the modified
polyester in all samples. Figure 4.1c shows the tensile and flexural strength, meanwhile Fig. 4.1d shows the tensile and flexural modulus for all samples. Samples with
5 wt% of aluminum phosphate produce the highest strength value in both tensile
and flexural testing. Both flexural strength and modulus observed higher values
compared to tensile strength and modulus in all design layers. Flexural strength
recorded its highest values in samples A and C with 281.15 MPa and 278.15 MPa,
respectively. Samples B recorded the lowest flexural strength with 261.52 MPa. The
highest value of the flexural modulus was in C with 15.02 GPa, followed by samples
A and B with 14.83 and 14.56 GPa, respectively. The observed flexural modulus gives
higher values than the tensile modulus in all samples. The flexural modulus reveals a
similar trend as the flexural strength with the highest values recorded in samples with
5 wt% of aluminum phosphate. The observed tensile modulus for samples with 0
wt% of aluminum phosphate produces the highest values in all samples. The tensile
35
Fig. 4.1 Hybrid composite fiberglass samples A (3-layer CSM), B (3-layer WR) and C (CSM, WR,
CSM) with various percentage of aluminum phosphate (0, 5, 10wt%) (a) Image of Tensile specimen after testing; (b) Image of Flexural specimen after testing; (c) Tensile and Flexural strength;
(d) Tensile and Flexural Modulus
layers CSM) with 0 wt% aluminum phosphate and specimen C (CSM, WR, CSM)
with 0 wt% of aluminum phosphate. WR shows a good interaction with the modified
polyester in all samples. Figure 4.1c shows the tensile and flexural strength, meanwhile Fig. 4.1d shows the tensile and flexural modulus for all samples. Samples with
5 wt% of aluminum phosphate produce the highest strength value in both tensile
and flexural testing. Both flexural strength and modulus observed higher values
compared to tensile strength and modulus in all design layers. Flexural strength
recorded its highest values in samples A and C with 281.15 MPa and 278.15 MPa,
respectively. Samples B recorded the lowest flexural strength with 261.52 MPa. The
highest value of the flexural modulus was in C with 15.02 GPa, followed by samples
A and B with 14.83 and 14.56 GPa, respectively. The observed flexural modulus gives
higher values than the tensile modulus in all samples. The flexural modulus reveals a
similar trend as the flexural strength with the highest values recorded in samples with
5 wt% of aluminum phosphate. The observed tensile modulus for samples with 0
wt% of aluminum phosphate produces the highest values in all samples. The tensile