

162
Z. Salleh and A. R. Harun
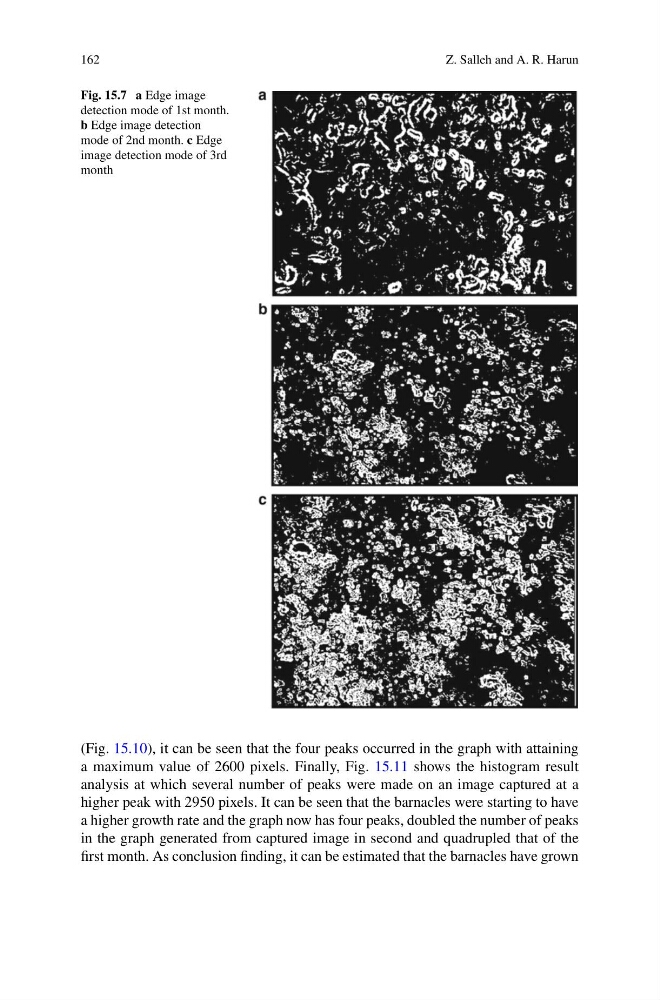
Fig. 15.7 a Edge image
detection mode of 1st month.
b Edge image detection
mode of 2nd month. c Edge
image detection mode of 3rd
month
(Fig. 15.10), it can be seen that the four peaks occurred in the graph with attaining
a maximum value of 2600 pixels. Finally, Fig. 15.11 shows the histogram result
analysis at which several number of peaks were made on an image captured at a
higher peak with 2950 pixels. It can be seen that the barnacles were starting to have
a higher growth rate and the graph now has four peaks, doubled the number of peaks
in the graph generated from captured image in second and quadrupled that of the
first month. As conclusion finding, it can be estimated that the barnacles have grown
Z. Salleh and A. R. Harun
Fig. 15.7 a Edge image
detection mode of 1st month.
b Edge image detection
mode of 2nd month. c Edge
image detection mode of 3rd
month
(Fig. 15.10), it can be seen that the four peaks occurred in the graph with attaining
a maximum value of 2600 pixels. Finally, Fig. 15.11 shows the histogram result
analysis at which several number of peaks were made on an image captured at a
higher peak with 2950 pixels. It can be seen that the barnacles were starting to have
a higher growth rate and the graph now has four peaks, doubled the number of peaks
in the graph generated from captured image in second and quadrupled that of the
first month. As conclusion finding, it can be estimated that the barnacles have grown