

15 Barnacles Growth Monitoring …
161
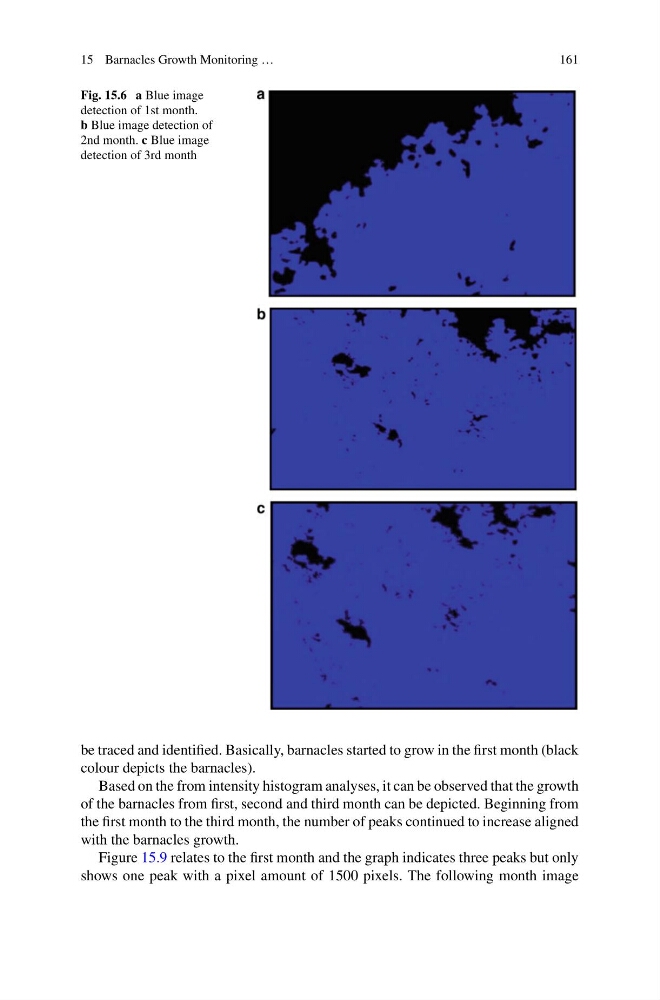
Fig. 15.6 a Blue image
detection of 1st month.
b Blue image detection of
2nd month. c Blue image
detection of 3rd month
be traced and identified. Basically, barnacles started to grow in the first month (black
colour depicts the barnacles).
Based on the from intensity histogram analyses, it can be observed that the growth
of the barnacles from first, second and third month can be depicted. Beginning from
the first month to the third month, the number of peaks continued to increase aligned
with the barnacles growth.
Figure 15.9 relates to the first month and the graph indicates three peaks but only
shows one peak with a pixel amount of 1500 pixels. The following month image
161
Fig. 15.6 a Blue image
detection of 1st month.
b Blue image detection of
2nd month. c Blue image
detection of 3rd month
be traced and identified. Basically, barnacles started to grow in the first month (black
colour depicts the barnacles).
Based on the from intensity histogram analyses, it can be observed that the growth
of the barnacles from first, second and third month can be depicted. Beginning from
the first month to the third month, the number of peaks continued to increase aligned
with the barnacles growth.
Figure 15.9 relates to the first month and the graph indicates three peaks but only
shows one peak with a pixel amount of 1500 pixels. The following month image