

160
Z. Salleh and A. R. Harun
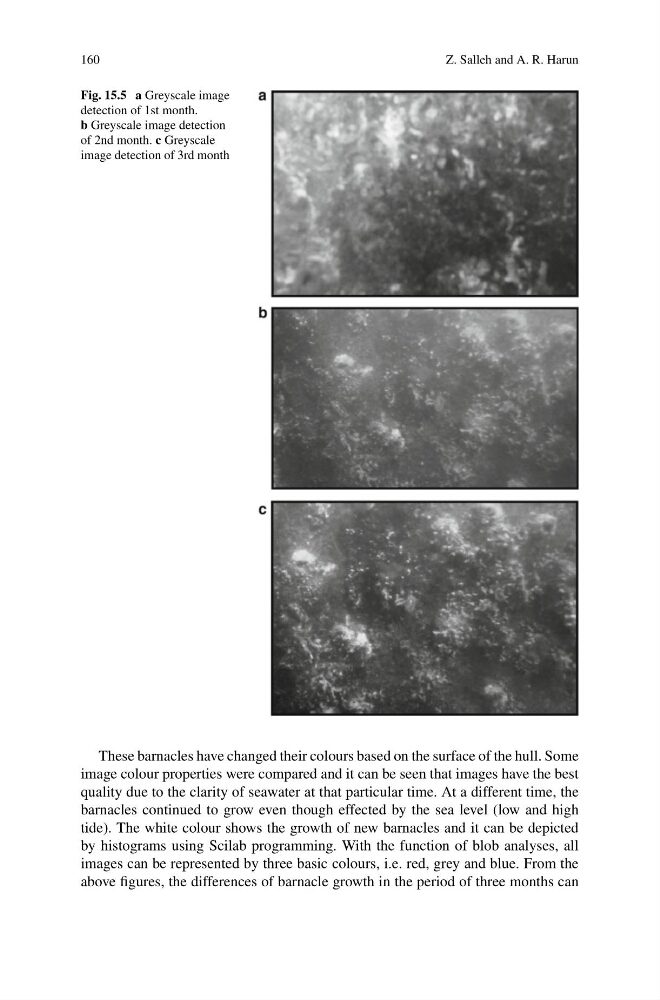
Fig. 15.5 a Greyscale image
detection of 1st month.
b Greyscale image detection
of 2nd month. c Greyscale
image detection of 3rd month
These barnacles have changed their colours based on the surface of the hull. Some
image colour properties were compared and it can be seen that images have the best
quality due to the clarity of seawater at that particular time. At a different time, the
barnacles continued to grow even though effected by the sea level (low and high
tide). The white colour shows the growth of new barnacles and it can be depicted
by histograms using Scilab programming. With the function of blob analyses, all
images can be represented by three basic colours, i.e. red, grey and blue. From the
above figures, the differences of barnacle growth in the period of three months can
Z. Salleh and A. R. Harun
Fig. 15.5 a Greyscale image
detection of 1st month.
b Greyscale image detection
of 2nd month. c Greyscale
image detection of 3rd month
These barnacles have changed their colours based on the surface of the hull. Some
image colour properties were compared and it can be seen that images have the best
quality due to the clarity of seawater at that particular time. At a different time, the
barnacles continued to grow even though effected by the sea level (low and high
tide). The white colour shows the growth of new barnacles and it can be depicted
by histograms using Scilab programming. With the function of blob analyses, all
images can be represented by three basic colours, i.e. red, grey and blue. From the
above figures, the differences of barnacle growth in the period of three months can