

15 Barnacles Growth Monitoring …
159
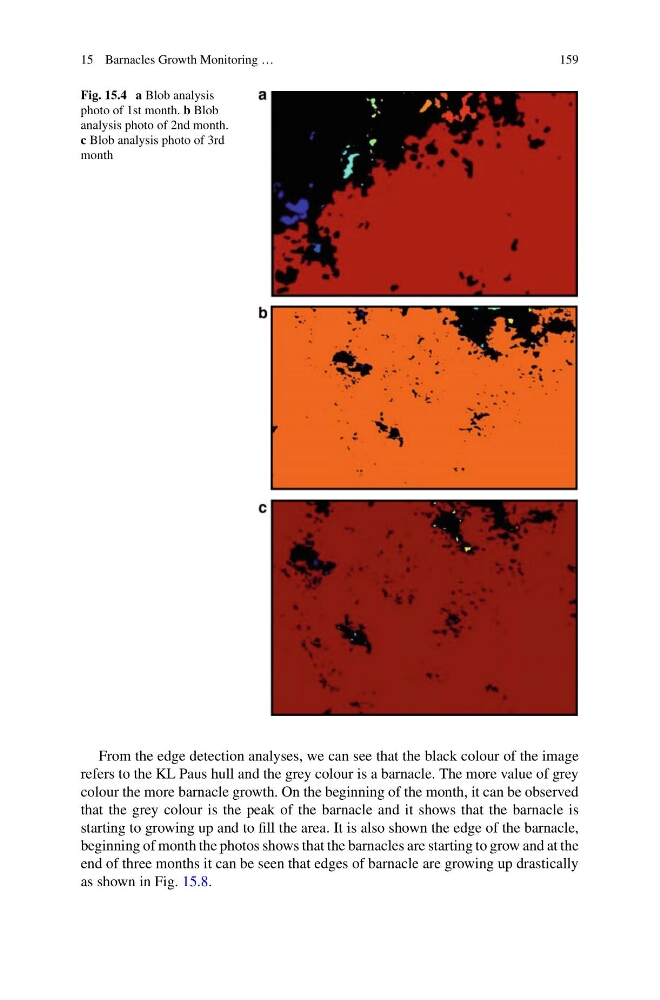
Fig. 15.4 a Blob analysis
photo of 1st month. b Blob
analysis photo of 2nd month.
c Blob analysis photo of 3rd
month
From the edge detection analyses, we can see that the black colour of the image
refers to the KL Paus hull and the grey colour is a barnacle. The more value of grey
colour the more barnacle growth. On the beginning of the month, it can be observed
that the grey colour is the peak of the barnacle and it shows that the barnacle is
starting to growing up and to fill the area. It is also shown the edge of the barnacle,
beginning of month the photos shows that the barnacles are starting to grow and at the
end of three months it can be seen that edges of barnacle are growing up drastically
as shown in Fig. 15.8.
159
Fig. 15.4 a Blob analysis
photo of 1st month. b Blob
analysis photo of 2nd month.
c Blob analysis photo of 3rd
month
From the edge detection analyses, we can see that the black colour of the image
refers to the KL Paus hull and the grey colour is a barnacle. The more value of grey
colour the more barnacle growth. On the beginning of the month, it can be observed
that the grey colour is the peak of the barnacle and it shows that the barnacle is
starting to growing up and to fill the area. It is also shown the edge of the barnacle,
beginning of month the photos shows that the barnacles are starting to grow and at the
end of three months it can be seen that edges of barnacle are growing up drastically
as shown in Fig. 15.8.