

158
Z. Salleh and A. R. Harun
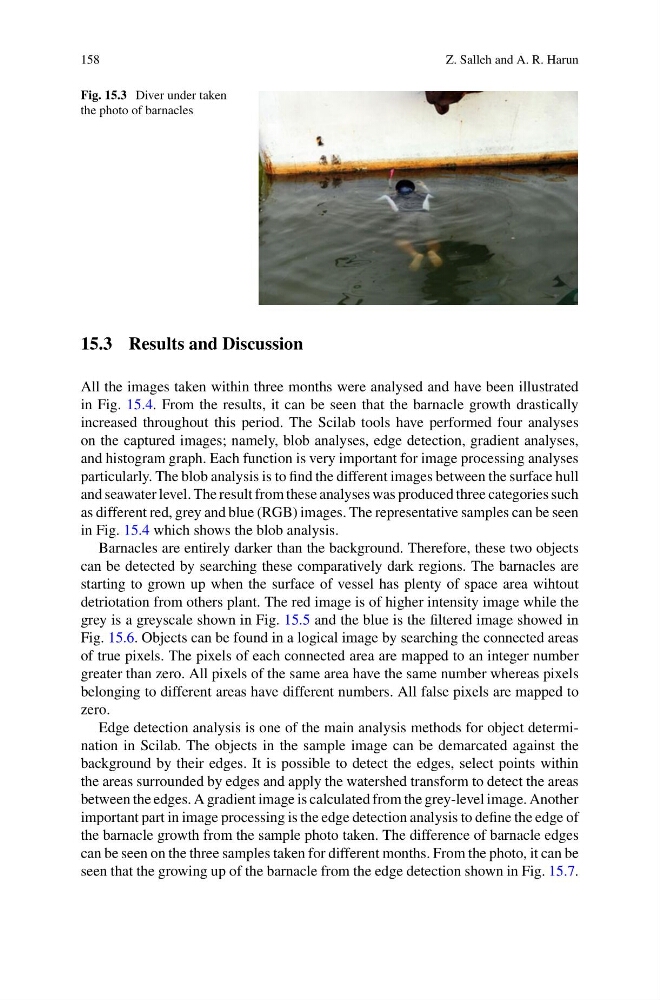
Fig. 15.3 Diver under taken
the photo of barnacles
15.3 Results and Discussion
All the images taken within three months were analysed and have been illustrated
in Fig. 15.4. From the results, it can be seen that the barnacle growth drastically
increased throughout this period. The Scilab tools have performed four analyses
on the captured images; namely, blob analyses, edge detection, gradient analyses,
and histogram graph. Each function is very important for image processing analyses
particularly. The blob analysis is to find the different images between the surface hull
and seawater level. The result from these analyses was produced three categories such
as different red, grey and blue (RGB) images. The representative samples can be seen
in Fig. 15.4 which shows the blob analysis.
Barnacles are entirely darker than the background. Therefore, these two objects
can be detected by searching these comparatively dark regions. The barnacles are
starting to grown up when the surface of vessel has plenty of space area wihtout
detriotation from others plant. The red image is of higher intensity image while the
grey is a greyscale shown in Fig. 15.5 and the blue is the filtered image showed in
Fig. 15.6. Objects can be found in a logical image by searching the connected areas
of true pixels. The pixels of each connected area are mapped to an integer number
greater than zero. All pixels of the same area have the same number whereas pixels
belonging to different areas have different numbers. All false pixels are mapped to
zero.
Edge detection analysis is one of the main analysis methods for object determination in Scilab. The objects in the sample image can be demarcated against the
background by their edges. It is possible to detect the edges, select points within
the areas surrounded by edges and apply the watershed transform to detect the areas
between the edges. A gradient image is calculated from the grey-level image. Another
important part in image processing is the edge detection analysis to define the edge of
the barnacle growth from the sample photo taken. The difference of barnacle edges
can be seen on the three samples taken for different months. From the photo, it can be
seen that the growing up of the barnacle from the edge detection shown in Fig. 15.7.
Z. Salleh and A. R. Harun
Fig. 15.3 Diver under taken
the photo of barnacles
15.3 Results and Discussion
All the images taken within three months were analysed and have been illustrated
in Fig. 15.4. From the results, it can be seen that the barnacle growth drastically
increased throughout this period. The Scilab tools have performed four analyses
on the captured images; namely, blob analyses, edge detection, gradient analyses,
and histogram graph. Each function is very important for image processing analyses
particularly. The blob analysis is to find the different images between the surface hull
and seawater level. The result from these analyses was produced three categories such
as different red, grey and blue (RGB) images. The representative samples can be seen
in Fig. 15.4 which shows the blob analysis.
Barnacles are entirely darker than the background. Therefore, these two objects
can be detected by searching these comparatively dark regions. The barnacles are
starting to grown up when the surface of vessel has plenty of space area wihtout
detriotation from others plant. The red image is of higher intensity image while the
grey is a greyscale shown in Fig. 15.5 and the blue is the filtered image showed in
Fig. 15.6. Objects can be found in a logical image by searching the connected areas
of true pixels. The pixels of each connected area are mapped to an integer number
greater than zero. All pixels of the same area have the same number whereas pixels
belonging to different areas have different numbers. All false pixels are mapped to
zero.
Edge detection analysis is one of the main analysis methods for object determination in Scilab. The objects in the sample image can be demarcated against the
background by their edges. It is possible to detect the edges, select points within
the areas surrounded by edges and apply the watershed transform to detect the areas
between the edges. A gradient image is calculated from the grey-level image. Another
important part in image processing is the edge detection analysis to define the edge of
the barnacle growth from the sample photo taken. The difference of barnacle edges
can be seen on the three samples taken for different months. From the photo, it can be
seen that the growing up of the barnacle from the edge detection shown in Fig. 15.7.