

15 Barnacles Growth Monitoring …
163
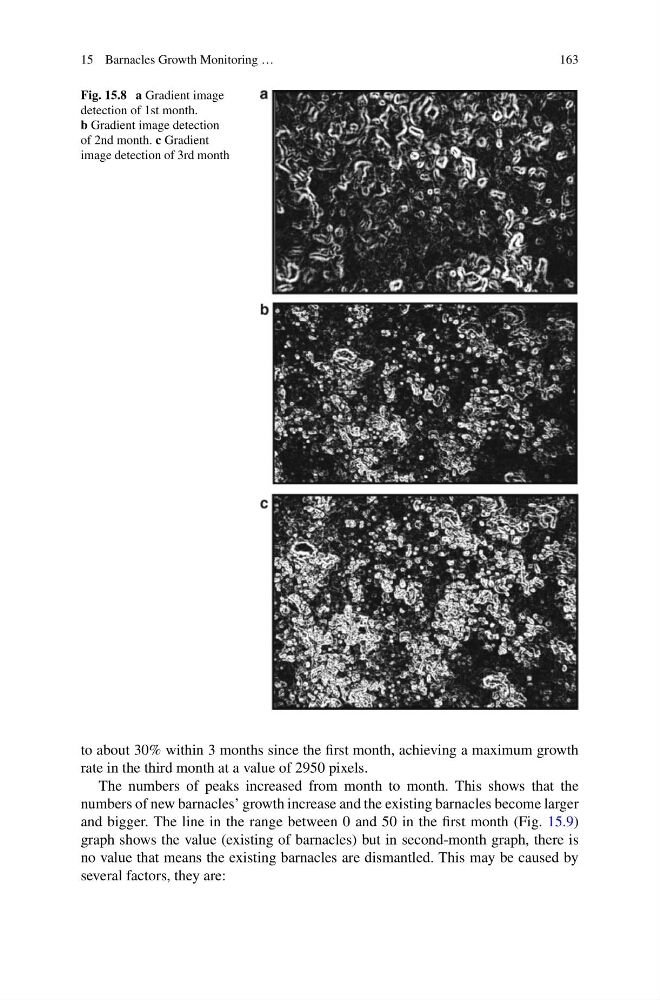
Fig. 15.8 a Gradient image
detection of 1st month.
b Gradient image detection
of 2nd month. c Gradient
image detection of 3rd month
to about 30% within 3 months since the first month, achieving a maximum growth
rate in the third month at a value of 2950 pixels.
The numbers of peaks increased from month to month. This shows that the
numbers of new barnacles’ growth increase and the existing barnacles become larger
and bigger. The line in the range between 0 and 50 in the first month (Fig. 15.9)
graph shows the value (existing of barnacles) but in second-month graph, there is
no value that means the existing barnacles are dismantled. This may be caused by
several factors, they are:
163
Fig. 15.8 a Gradient image
detection of 1st month.
b Gradient image detection
of 2nd month. c Gradient
image detection of 3rd month
to about 30% within 3 months since the first month, achieving a maximum growth
rate in the third month at a value of 2950 pixels.
The numbers of peaks increased from month to month. This shows that the
numbers of new barnacles’ growth increase and the existing barnacles become larger
and bigger. The line in the range between 0 and 50 in the first month (Fig. 15.9)
graph shows the value (existing of barnacles) but in second-month graph, there is
no value that means the existing barnacles are dismantled. This may be caused by
several factors, they are: