

124
A. K. Samanta et al.
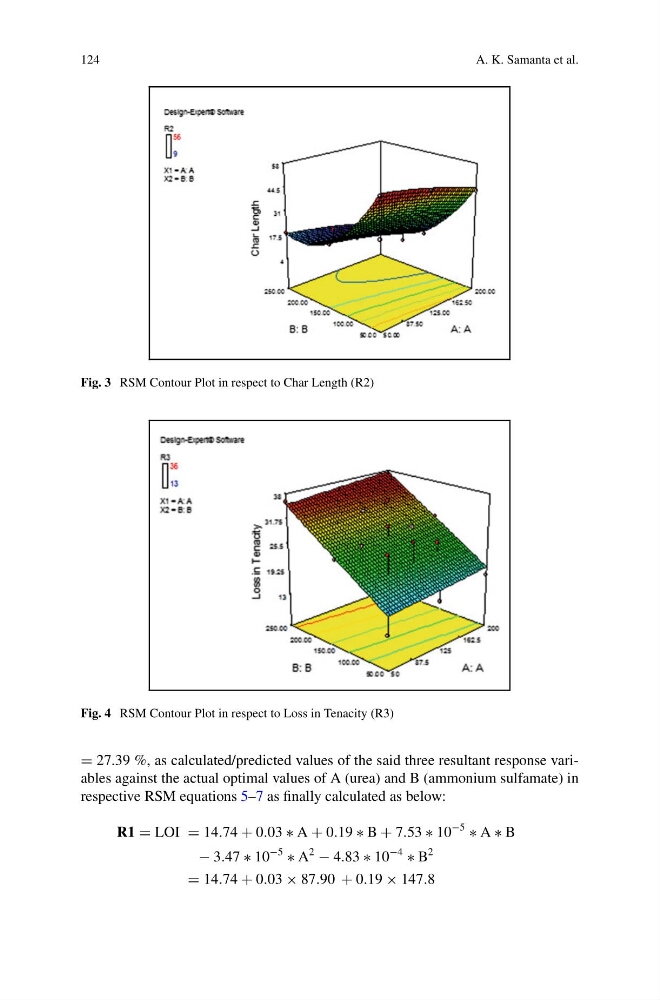
Fig. 3 RSM Contour Plot in respect to Char Length (R2)
Fig. 4 RSM Contour Plot in respect to Loss in Tenacity (R3)
= 27.39 %, as calculated/predicted values of the said three resultant response variables against the actual optimal values of A (urea) and B (ammonium sulfamate) in
respective RSM equations 5–7 as finally calculated as below:
R1 = LOI = 14.74 + 0.03 ∗ A + 0.19 ∗ B + 7.53 ∗ 10
−5
∗ A ∗ B
− 3.47 ∗ 10
−5
∗ A
2
− 4.83 ∗ 10
−4
∗ B
2
= 14.74 + 0.03 × 87.90 + 0.19 × 147.8
A. K. Samanta et al.
Fig. 3 RSM Contour Plot in respect to Char Length (R2)
Fig. 4 RSM Contour Plot in respect to Loss in Tenacity (R3)
= 27.39 %, as calculated/predicted values of the said three resultant response variables against the actual optimal values of A (urea) and B (ammonium sulfamate) in
respective RSM equations 5–7 as finally calculated as below:
R1 = LOI = 14.74 + 0.03 ∗ A + 0.19 ∗ B + 7.53 ∗ 10
−5
∗ A ∗ B
− 3.47 ∗ 10
−5
∗ A
2
− 4.83 ∗ 10
−4
∗ B
2
= 14.74 + 0.03 × 87.90 + 0.19 × 147.8