

Statistical Optimization of Ammonium Sulfamate and Urea-Based Fire …
125
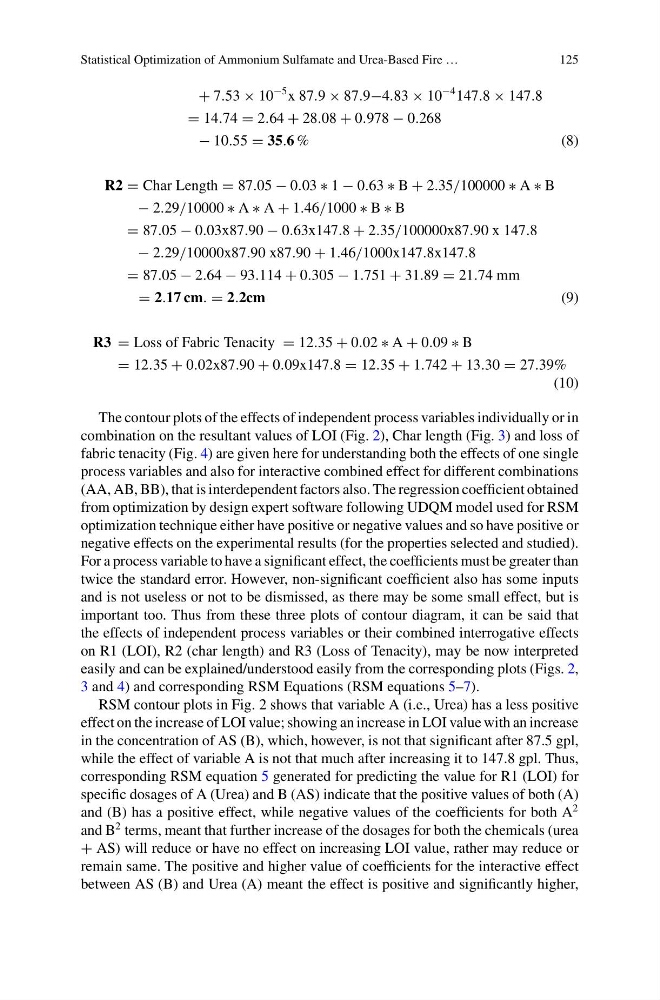
+ 7.53 × 10
−5 x 87.9 × 87.9−4.83 × 10
−4 147.8 × 147.8
= 14.74 = 2.64 + 28.08 + 0.978 − 0.268
− 10.55 = 35.6 %
( 8 )
R2 = Char Length = 87.05 − 0.03 ∗ 1 − 0.63 ∗ B + 2.35/100000 ∗ A ∗ B
− 2.29/10000 ∗ A ∗ A + 1.46/1000 ∗ B ∗ B
= 87.05 − 0.03x87.90 − 0.63x147.8 + 2.35/100000x87.90 x 147.8
− 2.29/10000x87.90 x87.90 + 1.46/1000x147.8x147.8
= 87.05 − 2.64 − 93.114 + 0.305 − 1.751 + 31.89 = 21.74 mm
= 2.17 cm. = 2.2cm
(9)
R3 = Loss of Fabric Tenacity = 12.35 + 0.02 ∗ A + 0.09 ∗ B
= 12.35 + 0.02x87.90 + 0.09x147.8 = 12.35 + 1.742 + 13.30 = 27.39%
(10)
The contour plots of the effects of independent process variables individually or in
combination on the resultant values of LOI (Fig. 2), Char length (Fig. 3) and loss of
fabric tenacity (Fig. 4) are given here for understanding both the effects of one single
process variables and also for interactive combined effect for different combinations
(AA, AB, BB), that is interdependent factors also. The regression coefficient obtained
from optimization by design expert software following UDQM model used for RSM
optimization technique either have positive or negative values and so have positive or
negative effects on the experimental results (for the properties selected and studied).
For a process variable to have a significant effect, the coefficients must be greater than
twice the standard error. However, non-significant coefficient also has some inputs
and is not useless or not to be dismissed, as there may be some small effect, but is
important too. Thus from these three plots of contour diagram, it can be said that
the effects of independent process variables or their combined interrogative effects
on R1 (LOI), R2 (char length) and R3 (Loss of Tenacity), may be now interpreted
easily and can be explained/understood easily from the corresponding plots (Figs. 2,
3 and 4) and corresponding RSM Equations (RSM equations 5–7).
RSM contour plots in Fig. 2 shows that variable A (i.e., Urea) has a less positive
effect on the increase of LOI value; showing an increase in LOI value with an increase
in the concentration of AS (B), which, however, is not that significant after 87.5 gpl,
while the effect of variable A is not that much after increasing it to 147.8 gpl. Thus,
corresponding RSM equation 5 generated for predicting the value for R1 (LOI) for
specific dosages of A (Urea) and B (AS) indicate that the positive values of both (A)
and (B) has a positive effect, while negative values of the coefficients for both A
2
and B
2 terms, meant that further increase of the dosages for both the chemicals (urea
+ AS) will reduce or have no effect on increasing LOI value, rather may reduce or
remain same. The positive and higher value of coefficients for the interactive effect
between AS (B) and Urea (A) meant the effect is positive and significantly higher,
125
+ 7.53 × 10
−5 x 87.9 × 87.9−4.83 × 10
−4 147.8 × 147.8
= 14.74 = 2.64 + 28.08 + 0.978 − 0.268
− 10.55 = 35.6 %
( 8 )
R2 = Char Length = 87.05 − 0.03 ∗ 1 − 0.63 ∗ B + 2.35/100000 ∗ A ∗ B
− 2.29/10000 ∗ A ∗ A + 1.46/1000 ∗ B ∗ B
= 87.05 − 0.03x87.90 − 0.63x147.8 + 2.35/100000x87.90 x 147.8
− 2.29/10000x87.90 x87.90 + 1.46/1000x147.8x147.8
= 87.05 − 2.64 − 93.114 + 0.305 − 1.751 + 31.89 = 21.74 mm
= 2.17 cm. = 2.2cm
(9)
R3 = Loss of Fabric Tenacity = 12.35 + 0.02 ∗ A + 0.09 ∗ B
= 12.35 + 0.02x87.90 + 0.09x147.8 = 12.35 + 1.742 + 13.30 = 27.39%
(10)
The contour plots of the effects of independent process variables individually or in
combination on the resultant values of LOI (Fig. 2), Char length (Fig. 3) and loss of
fabric tenacity (Fig. 4) are given here for understanding both the effects of one single
process variables and also for interactive combined effect for different combinations
(AA, AB, BB), that is interdependent factors also. The regression coefficient obtained
from optimization by design expert software following UDQM model used for RSM
optimization technique either have positive or negative values and so have positive or
negative effects on the experimental results (for the properties selected and studied).
For a process variable to have a significant effect, the coefficients must be greater than
twice the standard error. However, non-significant coefficient also has some inputs
and is not useless or not to be dismissed, as there may be some small effect, but is
important too. Thus from these three plots of contour diagram, it can be said that
the effects of independent process variables or their combined interrogative effects
on R1 (LOI), R2 (char length) and R3 (Loss of Tenacity), may be now interpreted
easily and can be explained/understood easily from the corresponding plots (Figs. 2,
3 and 4) and corresponding RSM Equations (RSM equations 5–7).
RSM contour plots in Fig. 2 shows that variable A (i.e., Urea) has a less positive
effect on the increase of LOI value; showing an increase in LOI value with an increase
in the concentration of AS (B), which, however, is not that significant after 87.5 gpl,
while the effect of variable A is not that much after increasing it to 147.8 gpl. Thus,
corresponding RSM equation 5 generated for predicting the value for R1 (LOI) for
specific dosages of A (Urea) and B (AS) indicate that the positive values of both (A)
and (B) has a positive effect, while negative values of the coefficients for both A
2
and B
2 terms, meant that further increase of the dosages for both the chemicals (urea
+ AS) will reduce or have no effect on increasing LOI value, rather may reduce or
remain same. The positive and higher value of coefficients for the interactive effect
between AS (B) and Urea (A) meant the effect is positive and significantly higher,