

Statistical Optimization of Ammonium Sulfamate and Urea-Based Fire …
123
equations—as Eqs. 5–7 for R1 (for LOI), R2 (for char length) and R3 (for loss in
tenacity), respectively. Putting the value of corresponding regression coefficients, the
predicted values of respective resultant variables can be determined/predicted from
corresponding RSM equations by following Eqs. 5–7 as given below:
R1 = 14.74 + 0.03 ∗ A + 0.19 ∗ B + 7.53 ∗ 10
−5
∗ A ∗ B − 3.47 ∗ 10
−5
∗ A
2
− 4.83 ∗ 10
−4
∗ B
2
(5)
R2 = 87.05 − 0.03 ∗ A − 0.63 ∗ B + 2.35/100000 ∗ A ∗ B − 2.29/10000
∗ A ∗ A + 1.46/1000 ∗ B ∗ B
( 6 )
R3 = 12.35 + 0.02 ∗ A + 0.09 ∗ B
( 7 )
It is apparent from the above three ANOVA tables (Tables 7, 8 and 9) that B
(ammonium sulfamate) is the most prominent factor followed by A (urea) affecting
the three resultant response variables. Both the two factor A and B have synergetic
effects on the three response variables (R1-LOI, R2-Char Length, R3-Loss in Fabric
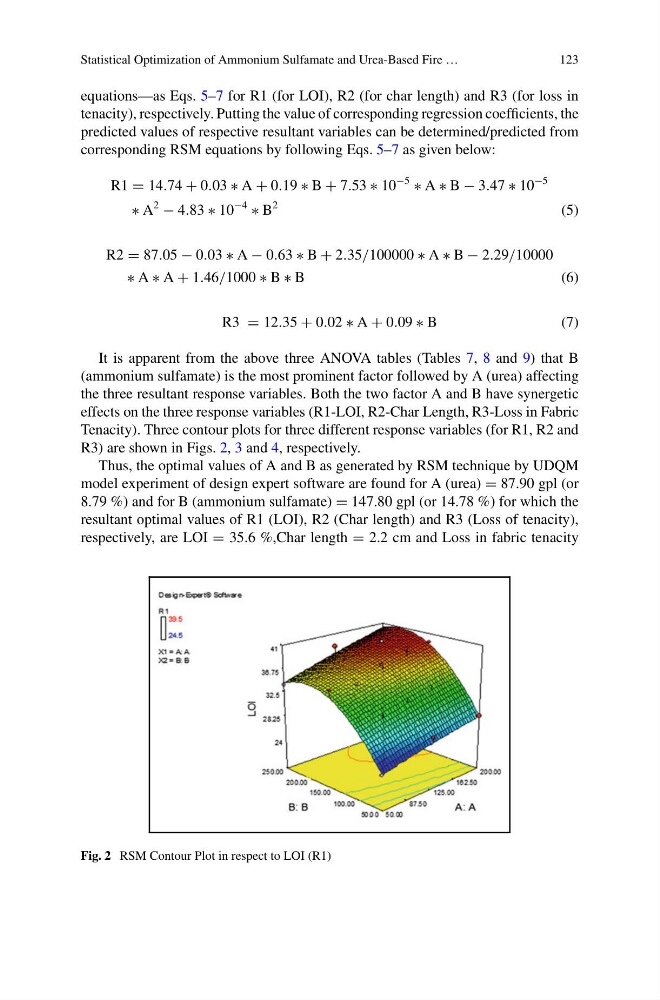
Tenacity). Three contour plots for three different response variables (for R1, R2 and
R3) are shown in Figs. 2, 3 and 4, respectively.
Thus, the optimal values of A and B as generated by RSM technique by UDQM
model experiment of design expert software are found for A (urea) = 87.90 gpl (or
8.79 %) and for B (ammonium sulfamate) = 147.80 gpl (or 14.78 %) for which the
resultant optimal values of R1 (LOI), R2 (Char length) and R3 (Loss of tenacity),
respectively, are LOI = 35.6 %,Char length = 2.2 cm and Loss in fabric tenacity
Fig. 2 RSM Contour Plot in respect to LOI (R1)
123
equations—as Eqs. 5–7 for R1 (for LOI), R2 (for char length) and R3 (for loss in
tenacity), respectively. Putting the value of corresponding regression coefficients, the
predicted values of respective resultant variables can be determined/predicted from
corresponding RSM equations by following Eqs. 5–7 as given below:
R1 = 14.74 + 0.03 ∗ A + 0.19 ∗ B + 7.53 ∗ 10
−5
∗ A ∗ B − 3.47 ∗ 10
−5
∗ A
2
− 4.83 ∗ 10
−4
∗ B
2
(5)
R2 = 87.05 − 0.03 ∗ A − 0.63 ∗ B + 2.35/100000 ∗ A ∗ B − 2.29/10000
∗ A ∗ A + 1.46/1000 ∗ B ∗ B
( 6 )
R3 = 12.35 + 0.02 ∗ A + 0.09 ∗ B
( 7 )
It is apparent from the above three ANOVA tables (Tables 7, 8 and 9) that B
(ammonium sulfamate) is the most prominent factor followed by A (urea) affecting
the three resultant response variables. Both the two factor A and B have synergetic
effects on the three response variables (R1-LOI, R2-Char Length, R3-Loss in Fabric
Tenacity). Three contour plots for three different response variables (for R1, R2 and
R3) are shown in Figs. 2, 3 and 4, respectively.
Thus, the optimal values of A and B as generated by RSM technique by UDQM
model experiment of design expert software are found for A (urea) = 87.90 gpl (or
8.79 %) and for B (ammonium sulfamate) = 147.80 gpl (or 14.78 %) for which the
resultant optimal values of R1 (LOI), R2 (Char length) and R3 (Loss of tenacity),
respectively, are LOI = 35.6 %,Char length = 2.2 cm and Loss in fabric tenacity
Fig. 2 RSM Contour Plot in respect to LOI (R1)