

122
A. K. Samanta et al.
Table 7 ANOVA table for response surface quadratic model for LOI (R1)
Source
Sum of squares df Mean square F value
p-value Prob > F Remarks
Model
335.61
5
67.12
60.5
< 0.0001
Significant
A-A
43.2
1
43.2
38.94
< 0.0001
B-B
217.62
1
217.62
196.16
< 0.0001
AB
1.36
1
1.36
1.22
0.2926
Aˆ2
0.11
1
0.11
0.095
0.7634
Bˆ2
64.8
1
64.8
58.41
< 0.0001
Residual
12.2
11
1.11
Cor total 347.81
16
Table 8 ANOVA table for response surface quadratic model for char length (R2)
Source
Sum of squares df Mean square F value
p-value Prob > F Remarks
Model
3650.88
5
730.18
43.98
< 0.0001
Significant
A-A
282.13
1
282.13
16.99
0.0017
B-B
2745.63
1
2745.63
165.36
< 0.0001
AB
0.13
1
0.13
7.97E-03
0.9305
Aˆ2
4.59
1
4.59
0.28
0.6093
Bˆ2
591.7
1
591.7
35.64
< 0.0001
Residual
182.65
11
16.6
Cor Total 3833.53
16
Table 9 ANOVA table for response surface quadratic model for loss in tenacity (R3)
Source
Sum of squares df Mean square F value p-value Prob > F Remarks
Model
600.43
2
300.22
44.03
< 0.0001
Significant
A-A
10.8
1
10.8
1.58
0.2288
B-B
589.63
1
589.63
86.48
< 0.0001
Residual
95.45
14
6.82
Cor Total 695.88
16
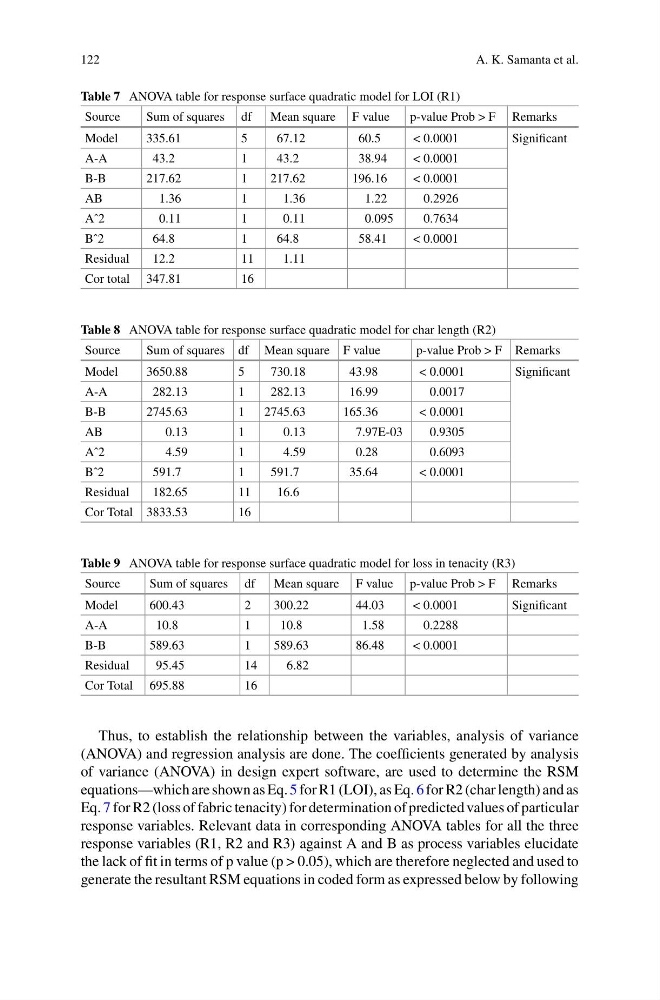
Thus, to establish the relationship between the variables, analysis of variance
(ANOVA) and regression analysis are done. The coefficients generated by analysis
of variance (ANOVA) in design expert software, are used to determine the RSM
equations—which are shown as Eq. 5 for R1 (LOI), as Eq. 6 for R2 (char length) and as
Eq. 7 for R2 (loss of fabric tenacity) for determination of predicted values of particular
response variables. Relevant data in corresponding ANOVA tables for all the three
response variables (R1, R2 and R3) against A and B as process variables elucidate
the lack of fit in terms of p value (p > 0.05), which are therefore neglected and used to
generate the resultant RSM equations in coded form as expressed below by following
A. K. Samanta et al.
Table 7 ANOVA table for response surface quadratic model for LOI (R1)
Source
Sum of squares df Mean square F value
p-value Prob > F Remarks
Model
335.61
5
67.12
60.5
< 0.0001
Significant
A-A
43.2
1
43.2
38.94
< 0.0001
B-B
217.62
1
217.62
196.16
< 0.0001
AB
1.36
1
1.36
1.22
0.2926
Aˆ2
0.11
1
0.11
0.095
0.7634
Bˆ2
64.8
1
64.8
58.41
< 0.0001
Residual
12.2
11
1.11
Cor total 347.81
16
Table 8 ANOVA table for response surface quadratic model for char length (R2)
Source
Sum of squares df Mean square F value
p-value Prob > F Remarks
Model
3650.88
5
730.18
43.98
< 0.0001
Significant
A-A
282.13
1
282.13
16.99
0.0017
B-B
2745.63
1
2745.63
165.36
< 0.0001
AB
0.13
1
0.13
7.97E-03
0.9305
Aˆ2
4.59
1
4.59
0.28
0.6093
Bˆ2
591.7
1
591.7
35.64
< 0.0001
Residual
182.65
11
16.6
Cor Total 3833.53
16
Table 9 ANOVA table for response surface quadratic model for loss in tenacity (R3)
Source
Sum of squares df Mean square F value p-value Prob > F Remarks
Model
600.43
2
300.22
44.03
< 0.0001
Significant
A-A
10.8
1
10.8
1.58
0.2288
B-B
589.63
1
589.63
86.48
< 0.0001
Residual
95.45
14
6.82
Cor Total 695.88
16
Thus, to establish the relationship between the variables, analysis of variance
(ANOVA) and regression analysis are done. The coefficients generated by analysis
of variance (ANOVA) in design expert software, are used to determine the RSM
equations—which are shown as Eq. 5 for R1 (LOI), as Eq. 6 for R2 (char length) and as
Eq. 7 for R2 (loss of fabric tenacity) for determination of predicted values of particular
response variables. Relevant data in corresponding ANOVA tables for all the three
response variables (R1, R2 and R3) against A and B as process variables elucidate
the lack of fit in terms of p value (p > 0.05), which are therefore neglected and used to
generate the resultant RSM equations in coded form as expressed below by following